US OLEFINS — SECOND-HALF 2010: Ethylene markets return to normal
Dan Lippe
Petral Worldwide Inc.
Houston
After the turmoil in operations and pricing during first-half 2010, US olefins markets were nearly normal during second-half 2010.
Ethylene producers pushed ethane demand to record highs during third-quarter 2010. Demand for ethane declined in fourth quarter due to turnarounds and unplanned outages demand but remained strong by historic standards. Midstream infrastructure constraints (particularly raw mix pipeline capacity) will limit further expansion of ethane supply for the next few years, but ethane production will be sufficient to support demand at 900,000-920,000 b/d during 2011. Despite record high demand, ethane prices in North America remained favorable relative to all other major ethylene feedstocks.
In the Gulf Coast propylene market, PL Propylene LLC completed construction on its propane dehydrogenation plant during third-quarter 2010 and began start-up during fourth quarter. This plant has nameplate capacity for polymer-grade propylene of 1.1 billion lb/year. Although output rates from this plant were well below capacity during fourth-quarter 2010, the third source of polymer-grade propylene production began to affect price-economic relationships in the Gulf Coast propylene market during third and fourth quarters 2010.
Feed slate trends
Petral's monthly survey results showed ethylene industry demand for fresh feed averaged 1.62 million b/d for third-quarter 2010 but declined to 1.56 million b/d for fourth-quarter 2010. Demand for fresh feed in third-quarter 2010 was 101,000 b/d higher (about 20%) than in third-quarter 2009, but demand in fourth-quarter 2010 was only 27,000 b/d higher than in fourth-quarter 2009. Despite the year-to-year increase during third and fourth quarters 2010, demand for fresh feed remained 57,000 b/d (3.5%) lower than prerecession levels of first-half 2008.
According to Petral survey results, demand for LPG feeds (ethane, propane, and normal butane) averaged 1.32 million b/d during third-quarter 2010 but declined to 1.24 million b/d during fourth-quarter 2010. Demand for LPG feed in third-quarter 2010 was 109,000 b/d (9%) higher than in third-quarter 2009. Demand for LPG feed in fourth-quarter 2010, however, was only 21,000 b/d (1.8%) higher than in fourth-quarter 2009.
Finally, demand for LPG feeds for second-half 2010 was 65,000 b/d (5%) higher than prerecession levels of first-half 2008. LPG feeds accounted for 82% of total fresh feed in third-quarter 2010 and 79% in fourth-quarter 2010. For 2005-07, LPG feeds accounted for 70% total fresh feed.
Ethane maintained its increases in share of fresh feed during third and fourth quarters 2010. Ethane's share of total fresh feed averaged 59% during third-quarter 2010 and 58% during fourth-quarter 2010. Ethane's share of fresh feed to LPG plants was 81% of fresh feed during third and fourth quarters 2010 and its share of fresh feed to multifeed plants was 47% during third and fourth quarters 2010 vs. only 43% during first and second quarters 2010.
Table 1 summarizes trends in olefin plant fresh feed.
Based on the view that economic recovery in North America will continue, ethylene producers will increase production to meet growth in demand for polyethylene and other ethylene derivatives during first-half 2011. On this basis, Petral forecasts ethylene plants in the US to operate at 88 92% of nameplate capacity in first and second quarters 2011.
Demand for fresh feed will average 1.60-1.65 million b/d during first and second quarters 2011. Demand for LPG feeds will average 1.20-1.25 million b/d during first and second quarters 2010, and ethane will continue to account for 57-58% of industry feed.
Fig. 1 illustrates historic trends in ethylene feed.
US ethylene production
Petral's survey results showed ethylene production from olefin plants totaled 13.5 billion lb in third-quarter 2010 but dipped to 12.9 billion lb in fourth-quarter 2010. Ethylene production for third and fourth quarters 2010 was 845 million lb higher than in first-half 2010.
Production from LPG plants totaled 4.78 billion lb in third-quarter 2010 and 4.75 billion lb in fourth-quarter 2010. Production from LPG plants during second-half 2010 was 257 million lb higher than in first-half 2010. Ethylene production from multifeed crackers totaled 8.69 billion lb in third-quarter 2010 but dipped to 8.13 billion lb in fourth-quarter 2010. Production from multifeed crackers for second-half 2010 was 536 million lb more than during first-half 2010.
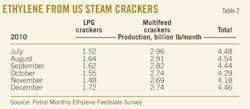
Table 2 summarizes trends in ethylene production.
Petral's short term outlook is based the expectation that LPG crackers will continue to operate at 93-95% capacity rates during first and second quarters 2011. Multifeed crackers will operate at 88-90% of nameplate capacity vs. 86% of capacity during second-half 2010.
Fig. 2 illustrates trends in ethylene production.
US propylene production
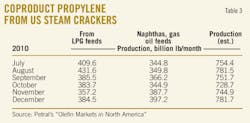
Although ethane's share of industry feed was at historically high levels during third and fourth quarters 2010, higher operating rates in multifeed crackers resulted in increased use of propane and heavy feeds. As a result, coproduct propylene from steam crackers was higher in third and fourth quarters 2010 than in second-quarter 2010. Coproduct propylene supply totaled 2.29 billion lb in third-quarter 2010 and was 80 million lb (3.6%) higher than in second-quarter 2010.
Feedstock prices, coproduct values, and ethylene plant yields determine ethylene production costs. Petral maintains direct contact with the olefin industry and tracks historic trends in spot prices for ethylene and propylene. We use a variety of sources to track trends in feedstock prices. Some ethylene plants have the necessary process units to convert all coproducts to purity streams. Some ethylene plants, however, do not have the capability to upgrade mixed or crude streams of various coproducts and sell some or all their coproducts at discounted prices. We evaluate ethylene production costs in this article based on all coproducts valued at spot prices. |
Total industry operating rates were slightly lower in fourth-quarter 2010 and coproduct propylene supply slipped to 2.20 billion lb, or 83 million lb less than in third-quarter 2010.
Propylene production from LPG feeds totaled 1.23 billion lb in third-quarter 2010 and 1.11 billion lb in fourth-quarter 2010. Production from LPG feeds in third-quarter 2010 was 51 million lb more than in third-quarter 2009. Production from LPG feeds in fourth-quarter 2010 was 53 million lb higher than in fourth-quarter 2009.
Propylene production from heavy feeds totaled 1.06 billion lb in third-quarter 2010. Production increased during fourth-quarter 2010 and totaled 1.09 billion lb. Production from heavy feeds in third-quarter 2010 was 62 million lb lower than in third-quarter 2009 but production in fourth-quarter 2010 was 22 million lb lower than in fourth-quarter 2009.
Table 3 shows trends in coproduct propylene supply.
Refinery propylene supply
Refinery propylene sales into the merchant market are a function of fluid catalytic cracking unit feed rates, FCCU operating severity, and economic incentives to sell propylene rather than use it as alkylate feed. Normally, refineries increase FCCU feed rates to peaks during second and third quarters, and they reduce feed rates and operating severity during fourth and first quarters. Propylene yields from FCC units are generally lower when FCC units operate at lower severity to increase refinery yields of distillate fuel oil.
US Energy Information Administration statistics indicate FCCU operating rates diverged from typical seasonal patterns during third-quarter 2010 but declined as expected in fourth-quarter 2010. EIA reported FCCU feed declined by 36,000 b/d in third-quarter 2010 and averaged 5.02 million b/d. At this volume, FCCU feed averaged 33.2% of crude runs and was unchanged from second-quarter 2010. In fourth-quarter 2010, EIA statistics indicate FCCU feed declined 404,000 b/d and averaged 4.62 million b/d, or 31.8%, of refinery crude runs.
According to EIA statistics, refinery-grade propylene production totaled 4.51 billion lb in third-quarter 2010 and increased to 4.54 billion lb in fourth-quarter 2010. Refinery-grade propylene production in third-quarter 2010 was 285 million lb less than in second-quarter 2010, consistent with the atypical decline in FCCU feed rates in third-quarter 2010.
Petral takes issue with EIA statistics that show refinery-grade propylene increased 22 million lb in fourth-quarter 2010 for two reasons. First, FCCU feed rates for refineries in the Gulf Coast and Midcontinent were 251,000 b/d (7%) lower in fourth-quarter 2010 than in third-quarter 2010. Second, spot prices for distillate fuel oil on the Gulf Coast averaged 14.4¢/gal higher than conventional unleaded regular gasoline prices during fourth-quarter 2010. Prices for distillate fuel oil in the Chicago pipeline market also maintained strong premiums vs. unleaded regular gasoline during fourth-quarter 2010. When distillate fuel oil prices are at premiums to gasoline prices, economics generally tell refineries to reduce operating severity for their FCC units. FCCU propylene yields are lower at lower operating severity.
Comparison of ratios of refinery propylene sales to FCCU feed rates shows dramatic increases in fourth-quarter 2010 for refineries in the Texas Gulf Coast and South Louisiana. In fourth-quarter 2010, the ratio of production to FCCU feed for the Texas Gulf Coast averaged 8.6-9.6% vs. an average of 7.5% for third-quarter 2010. Petral estimates indicate misreporting inflated refinery-grade propylene by 18-26%, or at least 470 million lb during fourth-quarter 2010.
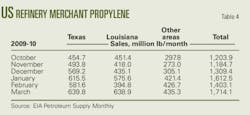
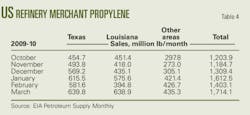
Table 4 shows EIA statistics for US refinery merchant propylene sales.
Based on EIA statistics for refinery-grade propylene (as published) and Petral estimates for coproduct supply, domestic propylene supply declined in third-quarter 2010 and totaled 6.80 billion lb, or 250 million lb lower than in second-quarter 2010. Petral estimates for coproduct propylene production during fourth-quarter 2010 and EIA statistics for October and November indicate US propylene production totaled 6.7 billion lb in fourth-quarter 2010 and was 100 million lb lower than in third-quarter 2010.
| PL Propylene LLC started up its propane dehydrogenation plant (located in the Houston Ship Channel) during fourth-quarter 2010. In the next olefins market article (OGJ, Sept. 5, 2011), Petral will estimate propylene supply from this plant. |
Based on analysis of FCCU operating rates, however, Petral estimates the actual volume of total US propylene production for fourth-quarter 2010 declined by 450-500 million lb and totaled only 6.3-6.4 billion lb. Finally, based on EIA statistics, total US propylene production was 0.9 billion lb higher than in fourth-quarter 2009 but was only 0.5 billion lb higher than in fourth-quarter 2009, based on adjustments to refinery-grade propylene supply.
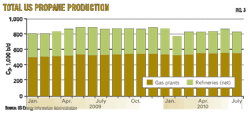
Fig. 3 shows trends in coproduct and refinery merchant propylene sales (as reported by EIA).
Ethylene economics, pricing
Production costs for ethylene in the Houston Ship Channel (assuming full spot prices for all coproducts) based on purity-ethane feeds averaged about 17¢/lb in third-quarter but increased to 23¢/lb in fourth-quarter 2010. Production costs based on ethane for third-quarter 2010 were about 2.5¢/lb lower than in second-quarter 2010 but were equal to year earlier costs. Purity ethane provided ethylene producers with cost savings of 11-13¢/lb vs. naphtha in third-quarter 2010 and incentives to use ethane vs. naphtha increased to 17-19¢/lb in fourth-quarter 2010.
Beginning in January 2010, a few US refining companies with plants on the Texas Gulf Coast, South Louisiana, and in the Upper Midwest changed how they reported components for mixed composition propane-propylene streams to the US Energy Information Administrtion. These changes affected the reported volume of refinery propylene supply and the net availability to the merchant market. Extensive Petral discussions with EIA personnel confirmed that these refineries now report their propane-propylene streams to EIA as 100% propylene. Previously, these companies reported mixed composition streams to EIA as 100% propane. This topic will continue to be an important subject of discussion and debate by the NGL Market Information Committee of the US Gas Processors Association and between the committee and the EIA. Until it is resolved, misreporting will continue to create uncertainty in the EIA statistics for refinery propylene supply. |
Production costs for purity propane averaged 22¢/lb in third-quarter 2010 and increased to 32-33¢/lb for fourth-quarter 2010. Although variable production costs were consistently higher than ethane, propane provided ethylene producers with a cost savings of 6-8¢/lb relative to light naphtha in third-quarter 2010 and 7-11¢/lb in fourth-quarter 2010.
Table 5 summarizes trends in ethylene production costs.
Ethylene pricing, margins
After ethylene producers resolved operating problems and completed turnarounds during second-quarter 2010, spot ethylene prices fell sharply in June and declined to the low for the year in July. According to daily pricing data from PetroChem Wire, from an average of 32.5¢/lb in July, prices crept slowly higher and averaged 37¢/lb in August but slipped to 34¢/lb in September. The contract benchmark price settled at 37¢/lb in July but settled at 39¢/lb for August and September due to rising production costs.
For third-quarter 2010, spot prices averaged and 34.4¢/lb, or 12.3¢/lb lower than the second-quarter average according to PetroChem Wire. The contract benchmark averaged 38.3¢/lb, or 7.3¢/lb lower than in second-quarter 2010.
The increase in crude oil prices pushed prices for naphtha and gas oil steadily higher in fourth-quarter 2010. Operating rates for both LPG plants and multifeed crackers were also lower in October and November due to turnarounds and unplanned maintenance outages but recovered in December. Spot ethylene prices increased to 38¢/lb in October and surged to 51¢/lb in November according to PetroChem Wire.
The contract benchmark settled higher in October (42.8¢/lb) and November (50.8¢/lb) but settled lower in December at 48.5¢/lb. For fourth-quarter 2010, spot prices for ethylene averaged 44.4¢/lb, and the contract benchmark averaged 47.3¢/lb.
As ethylene markets returned to normal following the turmoil of the second-quarter, margins based on spot prices were also weaker for all feedstocks in third-quarter 2010 than in second-quarter 2010. Margins based on purity-ethane production costs averaged 16.9¢/lb in third-quarter and 20.5¢/lb in fourth-quarter 2010 vs. 26.7¢/lb for second-quarter 2010. Margins based on propane averaged 11.1¢/lb in third-quarter 2010 and 11.3¢/lb in fourth-quarter 2010 vs. 23.8¢/lb in second-quarter 2010.
Ethylene producers who continued to crack natural gasoline and light naphtha experienced much weaker profitability during third and fourth quarters 2010. Profit margins for natural gasoline feeds averaged 2.0¢/lb in third-quarter 2010 vs. 11.7¢/lb in second-quarter 2010. Profit margins for natural gasoline were at breakeven in fourth-quarter 2010.
Fig. 4 shows historic trends in ethylene prices (spot prices and net transaction prices). Fig. 5 illustrates profit margins based on spot ethylene prices and production costs for ethane-propane (averaged for purity ethane and purity propane) and natural gasoline.
Refinery, polymer-grade C3=
During third-quarter 2010, spot prices for refinery-grade propylene moved gradually higher and averaged 44.5¢/lb vs. 43.5¢/lb in second-quarter 2010. Spot prices for refinery-grade propylene continue to move gradually higher in October and November but were sharply higher in December 2010 and averaged 60.1¢/lb for the month and averaged 51.3¢/lb for fourth-quarter 2010 according to PetroChem Wire.
The surge in refinery-grade propylene pricing during December 2010 was inconsistent with EIA's reports of increased refinery-grade propylene production during fourth-quarter 2010.
The premium for refinery-grade propylene prices vs. unleaded regular gasoline prices averaged 12.4¢/lb for third-quarter 2010 vs. 9.4¢/lb for second-quarter 2009. Premiums move gradually higher during fourth-quarter 2010 and averaged 12-13¢/lb for October and November but surged to 22.6¢/lb for December 2010. For fourth-quarter 2010, premiums averaged 16.1¢/lb.
Inventory trends for refinery-grade propylene provided support for stronger spot prices during third and fourth quarters 2010. During first-half 2010, according to EIA weekly inventory statistics, refinery-grade propylene inventory averaged 522 million lb. Inventory averaged 509 million lb during third-quarter 2010 but averaged only 371 million lb during fourth-quarter 2010, or 151 million lb (29%) lower than the first-quarter average.
Propylene buyers began to anticipate supply from the propane dehydrogenation plant during fourth-quarter 2010. This new supply source had a bearish impact on trends in the premium for polymer-grade propylene vs. refinery-grade propylene even before the new plant started up. During third-quarter 2010, the contract benchmark for polymer-grade propylene averaged 57.7¢/lb, or 7.2¢/lb lower than the average for second-quarter 2010. Additionally, the premium for polymer-grade propylene contract prices vs. spot refinery-grade propylene prices narrowed to 13.2¢/lb in third-quarter 2010. During fourth-quarter 2010, the contract benchmark averaged 58.8¢/lb, or a bare 1.2¢/lb higher than during third-quarter 2010. Furthermore, the premium for polymer-grade propylene vs. refinery-grade propylene narrowed to 7.6¢/lb. During fourth-quarter 2010, the premium narrowed to 0.4¢/lb in December vs. 12.6¢/lb in October.
First-half 2011 outlook
Spot prices for West Texas Intermediate crude oil began a sustained rally in late September, reaching almost $91/bbl during the last week of December. The cumulative increase of almost $16/bbl (21%) occurred even though domestic inventories of crude and distillate fuel oil were at historic highs.
Globally, key producers in the Middle East maintained strict discipline in accord with Organization of Petroleum Exporting Countries' production quota agreements, according to EIA statistics. Furthermore, EIA production data showed the rate of decline in North Sea production accelerated during 2009-10.
Finally, in the global distillate fuel-oil market, according to various news sources, China experienced shortages of diesel fuel, and the scramble to export diesel fuel contributed to strong bullish pressures on crude oil prices. As a result, WTI prices moved well beyond the established trading range of $70-80/bbl during fourth-quarter 2010.
Price forecasts for naphtha and distillate fuel oil and ethylene production costs are based on the more bullish view of global supply-demand trends; Petral forecasts WTI prices will average $85-100/bbl during first and second quarters 2011.
Variable production costs for light naphtha have been a key driver for spot ethylene prices since 2008. Those spot prices averaged only 0.9¢/lb higher than variable production cost for natural gasoline during third and fourth quarters 2010. Petral forecasts variable production costs for natural gasoline will average 41-44¢/lb and spot ethylene prices will average 44-48¢/lb during first and second quarters 2011.
Petral forecasts ethylene production costs will average 23-26¢/lb for purity ethane and 31-34¢/lb for purity propane during first and second quarters 2011. Profit margins will average 18-22¢/lb for purity ethane and 12-15¢/lb for purity propane.
Petral also forecasts polymer-grade propylene will average 70-75¢/lb during first-quarter 2011 and 65-68¢/lb during second-quarter 2011. Based on differentials of 3-5¢/lb, refinery-grade propylene prices will average 66-72¢/lb during first-quarter 2011 and 60-62¢/lb during second-quarter 2011.
The author
More Oil & Gas Journal Current Issue Articles
More Oil & Gas Journal Archives Issue Articles
View Oil and Gas Articles on PennEnergy.com
