US midstream industry anticipates surge in ethane demand, exports
Dan Lippe
Petral Consulting Co.
Houston
With the start of deepwater ethane exports from Sunoco Logistics Partners LP's Marcus Hook, Pa., terminal in first-quarter 2016 and Enterprise Products Partners (EPP) LP's terminal at Morgan's Point, Tex., in the third quarter, the US midstream industry entered a new era.
Before exports, ethane produced by midstream companies in North America was consumed as feedstock solely in North American ethylene plants. With ethane now shipping from US terminals for delivery to ethylene plants in Northwest Europe and India via a small fleet of specially designed vessels, the impending surge in waterborne exports and feedstock demand in 2017-18 will require most US gas processing plants, which have operated in ethane-rejection mode since 2013, to swing to full-ethane recovery rates by late 2018. A significant improvement in gas processing profitability will accompany this return to full-ethane recovery.
By yearend 2016 or first-quarter 2017, US ethylene producers will increase capacity by 1.4 billion lb/year with startup of two incremental expansions, LyondellBasell's 800-million lb/year project at Corpus Christi, Tex. (OGJ Online, June 3, 2016), and Dow Chemical Co.'s LA-3 Crack More Ethane project at its petrochemical plant in Plaquemine, La. Occidental Chemical Corp. (OxyChem) and Mexichem SAB de CV (Mexichem) also will commission their 50-50 joint-venture Ingleside Ethylene LLC 1.2-billion lb/year ethane cracker at Ingleside, Tex., in early 2017 (OGJ Online, Feb. 26, 2016), the first of five grassroots ethylene plants currently planned for North America.
By yearend 2018, US in-service ethylene capacity will be 80 billion lb/year, or 17.4 billion lb/year more than in September 2016.
NGL raw-mix production
Gas-plant NGL production has been the primary driver for most of the midstream industry's infrastructure expansion projects. Growth in crude oil production and resulting increases in associated gas production are, and will remain, the primary drivers of gas-plant NGL production trends.
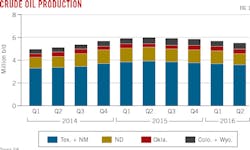
US crude oil production increased at accelerating rates until the late-2014 collapse in prices reduced oil-directed drilling activity.
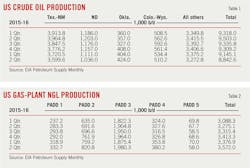
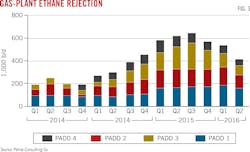
Statistics from the US Energy Information Administration (EIA) showed crude production in the US Gulf Coast, Midcontinent, and Rocky Mountains during second-quarter 2016 was down 573,000 b/d, or 6.9%, vs. second-quarter 2015 (Fig. 1). Total production of NGLs (propane, butanes, natural gasoline) in these three regions also fell in second-quarter 2016, albeit at much slower rates. NGL production at the Gulf Coast during second-quarter 2016 was 20,100 b/d, or 1.7%, less than in second-quarter 2015. While the slower rate of decline in propane+ production during second-quarter 2016 indicates lower production of associated gas, this decline still lagged the drop in crude production in the same period.
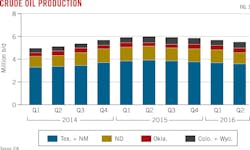
Table 1 summarizes quarterly trends in US crude oil production.
Regional trends
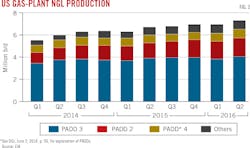
US gas-plant NGL production continued to increase in first-half 2016. In first-quarter 2016, gas-plant NGL production was 3.37 million b/d and increased to 3.57 million b/d in the second quarter. NGL production in first-quarter 2016 was 288,600 b/d more than in the first quarter of 2015. Production in second-quarter 2016 was up 296,900 b/d vs. the same period in 2015 (Table 2).
Changes in ethane rejection, however, have a significant impact on annual growth in US NGL production, as was the case in first-half 2016, with trends in propane+ production providing a clearer view of year-over-year growth in NGL output.
Production of propane+ was 2.18 million b/d in first-quarter 2016 and 2.23 million b/d in second-quarter 2016 for year-on-year growth of 144,500 b/d for the first quarter but only 50,800 b/d the second quarter. Petral Consulting Co. expects NGL production (propane+) will av-erage 2.25-2.28 million b/d (equal to or slightly lower than 2015) in third-quarter 2016 and 2.20-2.22 million b/d (also equal to or slightly lower vs. 2015) in fourth-quarter 2016.
NGL production from new gas plants in eastern Ohio's Utica shale during first-half 2016 continued to support growth in overall US Midcontinent NGL production. Production from gas plants in the eastern Upper Midwest was 194,000 b/d in first-quarter 2016, or 35,200 b/d higher from the same quarter in 2015, according to EIA data. During second-quarter 2016, production increased to 205,400 b/d, a decrease of 27,600 b/d vs. second-quarter 2015. Year-over-year growth in NGL raw-mix production in the eastern Upper Midwest was 79,300 b/d for first-quarter 2016 but slowed to 63,600 b/d for the second quarter, according to EIA (Fig. 2).
Ethane rejection, NGL raw-mix production
Spot prices for purity ethane and ethane-propane mix in Mont Belvieu, Tex., remained well below levels that would support full-ethane recovery in January-February 2016, but increased by 8¢/gal (55%) in March-June. Recovery margins for gas plants in Texas-New Mexico improved to breakeven levels in March. Gas-plant ethane production in Texas increased by 65,000 b/d in March and by an additional 27,000 b/d in May-June.
Petral Consulting estimates ethane rejection was 540,000 b/d in first-quarter 2016 and fell to 416,000 b/d during the second quarter (Fig. 3).
If gas processors had operated all gas plants at full ethane-recovery mode, total US NGL production would have been 3.9-4.0 million b/d in first-half 2016.
By mid-2017 petrochemical companies will complete construction of several new ethylene plants (OGJ, July 6, 2015, p. 74). During third-quarter 2016 and through yearend 2017, new ethylene plants will increase ethane demand by 400,000-500,000 b/d. Petral Consulting also estimates exports from Morgan's Point will increase to 80,000-120,000 b/d in first-half 2017.
By mid-2017 US gas plants in core producing regions will have to operate in full ethane-recovery mode to meet rising demand for exports. Ethylene demand will continue to increase as Indorama Ventures Olefins LLC and Shintech Inc. bring on stream 2 billion lb/year of new capacity in Louisiana in 2018 (OGJ Online, Aug. 31, 2016; Apr. 23, 2015).
NGL market overview
Three markets account for more than 90% of US NGL demand:
• Petrochemical feedstock.
• Gasoline blending.
• Retail space heating and internal combustion.
All five NGL components are used as feedstock in petrochemical production, and normal butane, isobutene, and natural gasoline are used in gasoline blending. Retail space heating and internal combustion-engine markets, however, consume only propane. Of the three primary domestic end-use markets, only the petrochemical industry has the potential to considerably increase domestic NGL consumption. During 2017-19 petrochemical companies will start up a minimum of 15 billion lb/year of new ethylene capacity, almost all of which will be based on purity-ethane feedstock.
Petral Consulting estimates ethylene feedstock demand by direct contact with ethylene producers. Other segments of the petrochemical industry include propane dehydrogenation (propane), methyl tertiary butyl ether (MTBE; normal butane and isobutane), and propylene oxide (isobutane).
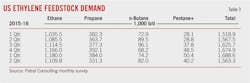
NGL demand in the ethylene feedstock market was 1.69 million b/d in first-quarter 2016 but fell to 1.56 million b/d in second-quarter 2016. Demand for NGL feeds in first-quarter 2016 was 169,600 b/d, or 11.2%, higher vs. first-quarter 2015 because ethylene producers operated at 97% of nameplate capacity vs. operating at 89% capacity during first-quarter 2015.
NGL feedstock demand during second-quarter 2016 was down 125,300 b/d from the previous quarter and 4,200 b/d lower vs. second-quarter 2015 alongside planned maintenance work during April-June 2016. One turnaround extended into third-quarter 2016, while another plant entered an extended turnaround in September. As a result of these outages, Petral Consulting estimates demand for NGL feeds during third-quarter 2016 was 1.55-1.60 million b/d.
Ethane accounted for 70-71% of ethylene industry NGL feedstock demand in first-half 2016. Demand for ethane as feedstock in domestic ethylene plants increased to 1.18 million b/d in first-quarter 2016, hitting a new record-high on a quarterly average basis of 1.19 million b/d in March 2016 (Table 3).
Gasoline blending demand
The refining industry is the second largest industrial-commercial market for NGLs. As is true for propane demand in retail markets, refinery demand for normal butane is strongly seasonal, but demand for isobutane and natural gasoline is only moderately seasonal.
Refinery demand for normal butane reaches its seasonal peak November through January, while refinery demand for isobutane and natural gasoline is usually at its seasonal peak May through August. The counter-cyclical nature of refinery demand for isobutane and natural gasoline offsets some of the strongly seasonal demand for normal butane. Refineries purchase gas-plant normal butane during the offseason for use as clean feed to internal butane isomerization units.
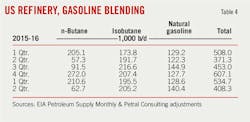
EIA statistics for refinery inputs show demand for butanes and natural gasoline was 534,000 b/d in first-quarter 2016 before declining to 408,300 b/d in the second quarter. Refinery inputs of gas-plant normal butane were 210,600 b/d in first-quarter 2016, or 5,500 b/d more than in the first quarter of 2015. Consistent with the shift to summer RVP limits, refinery inputs of gas-plant normal butane declined to 62,700 b/d in second-quarter 2016, still up 5,400 b/d, or 9.3%, vs. second-quarter 2015, according to EIA data.
EIA statistics show refinery inputs of isobutane decreased to 195,500 b/d in first-quarter 2016 vs. 207,400 b/d in fourth-quarter 2015. The quarterly decline was consistent with seasonal operating trends in first-quarter 2016, including reduced crude runs and lower feed rates at fluid catalytic cracking units (FCCU). Refinery inputs of isobutane during the first 3 months of 2016, however, were 21,700 b/d (12.5%) higher vs. the same period in 2015. During second-quarter 2016, as crude runs and FCCU feed rates rebounded, refinery inputs of isobutane increased to 205,200 b/d, up 13,500 b/d vs. second-quarter 2015.
The factors that determine refinery demand for natural gasoline differ from demand drivers for normal butane and isobutane. Petral Consulting's ongoing economic analysis indicates refineries primarily seek natural gasoline for use as supplemental feed to pentane-hexane isomerization units. While some refineries have these units, many do not. This consideration results in demand variability that is not seasonal. According to EIA statistics, refinery demand for natural gasoline was 128,600 b/d in first-quarter 2016 before increasing to 140,400 b/d in the second quarter (Table 4).
Retail markets, NGL exports
Propane demand in retail markets is variable and dependent on weather patterns in the northern hemisphere. Retail markets consume propane in four primary end-use segments:
• Residential, commercial, and resellers (space-heating markets).
• Agriculture.
• Motor fuel.
• Miscellaneous industrial.
Of these four segments, consumption in the residential-commercial sector typically accounts for 75-80% of total demand in the retail market. Petral Consulting estimates retail propane demand in all end-use sectors was 880,000-900,000 b/d in first-quarter 2016. Winter weather remained milder in second-quarter 2016, decreasing demand to 220,000-230,000 b/d for the 3-month period.
Waterborne exports continued to gain importance in 2015 as an outlet for surplus US LPG supply. According to statistics published by US International Trade Commission (USITC), NGL exports (LPG exports + ethane and natural gasoline exports) were 1.18 million b/d in first-quarter 2016 and 1.20 million b/d in second-quarter 2016. NGL exports in the first quarter were 318,000 b/d, or 37%, more than in first-quarter 2015, while exports in the second quarter were 268,000 b/d (29%) higher vs. second-quarter 2015.
Propane exports accounted for 70% of total NGL exports in first-quarter 2016 but only 65% in the second quarter. Detailed statistics published by USITC show propane exports to destinations in Asia Pacific were 357,000 b/d in January 2016 and increased to 459,000 b/d in February 2016, with all exports to the region originating from terminals on the Texas Gulf Coast. Exports to Asia Pacific accounted for 45% of total exports in January and increased to 57% in February. Exports of propane to Asia Pacific from Texas Gulf Coast terminals in January 2016 were 303,000 b/d more than in January 2015, with exports in February 209,000 b/d more than in February 2015.
US butane exports also continued to increase during first-half 2016. Total butane exports to all destinations were 94,300 b/d in the first quarter, or 22,600 b/d more than in first-quarter 2015, while exports during second-quarter 2016 were 134,900 b/d, or 24,200 b/d higher compared with second-quarter 2015 (Table 5).
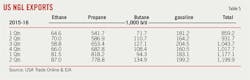
EIA statistics show total US ethane exports were 81,500 b/d in first-quarter 2016, increasing to 87,000 b/d in the second quarter. Canada remained the primary destination for US ethane exports for first-half 2016, but waterborne exports to destinations other than Canada commenced in first-half 2016.
Exports to Canada originate from supply sources at the US East Coast and Midcontinent, moving into Canada via dedicated pipelines, including the Mariner West and Vantage pipelines. Various gas plants and fractionators in Pennsylvania and Ohio deliver ethane into Mariner West, which delivers ethane to ethylene plants in Sarnia, Ont. Vantage pipeline collects ethane from gas plants and fractionators in North Dakota and delivers ethane into the Alberta Ethane Gathering System (AEGS) for consumption by ethylene plants in the province.
Petral Consulting estimates exports to Sarnia were 57,000 b/d in first-quarter 2016 but dipped to about 40,000 b/d in the second quarter, while first-quarter exports to Alberta were 19,500 b/d and rose to 22,800 b/d during the second quarter. Total exports into Canada averaged 76,500 b/d in first-quarter 2016 and 62,800 b/d in the second quarter.
EIA statistics show ethane exports from Sunoco Logistics' Marcus Hook terminal were 25,100 b/d in second-quarter 2016. With startup of ethane exports from EPP's Morgan's Point terminal in August, Petral Consulting estimates combined US ethane exports from the two terminals to eth-ylene producers in Europe and India in 2017 will surge to 100,000-200,000 b/d.
Midstream infrastructure
NGL midstream companies have built and operated four basic elements of infrastructure:
• Gas processing plants.
• Raw mix purity-product transportation systems.
• Fractionators.
• Storage.
The midstream industry has historically focused its resources and management efforts on expanding capacity in the first three elements but made no investment in expanding NGL storage and affiliated infrastructure. As US NGL supplies have increased to chronic surplus, however, a few midstream companies have expanded the industry's fifth element: LPG import-export terminals. With the addition of one more US export terminal by yearend 2016, Petral Consulting expects export capacity will be more than sufficient to handle NGL supply surpluses through 2020 and perhaps 2025.
During May-September 2016, US crude oil producers increased the oil-directed rig count by about 95 rigs. EIA statistics show US crude oil production (excluding Alaska) was 8.39 million b/d in May but fell to 8.04 million b/d in September. This simple comparison suggests the rebound in the oil-directed rig count has had little impact on US crude production. While EIA weekly statistics show crude oil production (excluding Alaska) declined at 39,300 b/d per week in May, the decline rate had slowed to zero by August and September.
The increase in the oil-directed rig count in Texas and New Mexico accounted for 74% of the increase in the total US rig count. If the oil-directed rig count remains within a range of 300-400 during the next 1-2 years, crude oil production in Texas and New Mexico likely will remain almost constant but could begin to show signs of a slow decline.
Eventually, however, crude oil prices will recover enough to support a sustained increase in oil-directed drilling activity and, with it, a growth in NGL supply. As such, this article reviews the current status of NGL raw-mix pipeline infrastructure.
Midstream companies currently operate 14 NGL raw-mix pipelines that deliver raw-mix supply from gas plants in the Rocky Mountains, New Mexico, West Texas, South Texas, North-Central Texas, and Oklahoma to storage and fractionation sites in the upper Texas Gulf Coast. Petral Consulting estimates these pipelines have a combined capacity of about 2 million b/d and that production from gas plants in these areas during first-half 2016 was 1.9 million b/d. After accounting for raw mix processed by fractionators in West Texas, South Texas, and New Mexico, as well as other reasonable deductions, Petral Consulting estimates current throughput rates along these pipelines at 1.70-1.75 million b/d.
During the next 18-24 months, gas plants in these three regions will swing from ethane rejection to full-ethane recovery mode. Petral Consulting estimates the swing to full-ethane recovery will boost NGL raw-mix production to 2.0-2.1 million b/d, with throughput for raw-mix pipelines increasing to 1.90-1.95 million b/d. Capacity utilization will increase to 93-95% by yearend 2018, and raw-mix pipeline capacity will become a constraint before 2020.
Price trends, profitability
Petral Consulting tracks gas processing economics based on netback values of NGL raw mix for gas plants in Texas, New Mexico, and the Rocky Mountains. Gas plants in these regions are the primary sources of NGL raw-mix deliveries to fractionators in Mont Belvieu.
With the exception of a 60 to 90-day rally in ethane prices in second-quarter 2016, supply remained surplus to local market demand for propane, normal butane, and natural gasoline during first-half 2016. As a result, spot prices in Mont Belvieu for propane, normal butanes, and natural gasoline remained weak.
Petral Consulting estimates the weighted-average price of NGL raw-mix supply in Mont Belvieu was 37¢/gal ($4.03/MMbtu) in first-quarter 2016. Prices recovered to 46¢/gal ($5.07/MMbtu) in second-quarter 2016. The volume-weighted average for third-quarter 2016 was 44¢/gallon ($4.81/MMbtu). This left prices during the first three quarters of 2016 lower vs. pricing in first-half 2015.
Historically, competition among various feedstock options available to ethylene plants along the Texas-Louisiana Gulf Coast has been the paramount influence on Mont Belvieu NGL prices. While competitive economics in the Gulf Coast ethylene industry remain an important influence, the role of international markets has evolved into what may now be the paramount influence.
Two factors are important considerations for the economics of the international market. First, terminal fees are a significant economic hurdle for US Gulf Coast exports. Second, freights rates from Houston to Northeast Asia will always be higher vs. exports originating from Middle Eastern ports. Although increased competition will influence both terminal fees and freight rates, delivery of new very large gas carriers (VLGC) already has affected freight rates and prices in Mont Belvieu.
While freight rates for deepwater LPG trade in international markets were at historically high levels in first-half 2015, this preceded the start of deliveries of new LPG vessels to ship owners in second-half 2015 as well as an ongoing increase in VLGC capacity during first-half 2016. Freight rates from the Port of Houston to the Port of Tokyo were $95/tonne in first-quarter 2016, less than half the $203/tonne rate from the same quarter in 2015. Freight rates from Houston to Tokyo continued to fall during second-quarter 2016 to $65/tonne, or $158/tonne (70.8%) lower vs. second-quarter 2015. By the middle of third-quarter 2016, Houston-to-Tokyo freight rates were $45-50/tonne, or $169/tonne (77.3%) less compared with the same period a year earlier.
Additional LPG vessels are slated for delivery in second-half 2016. As new vessels continue entering service, freight rates likely will remain weak, at least for the next 3 years. If US LPG supply holds constant during the next 2-3 years, global LPG trade will stabilize unless demand in Northeast Asia begins to decline.
NGL exports from US Gulf Coast terminals to Northwest Europe accounted for 10.6% of overall exports, while shipments to Northeast Asia accounted for 50.6%. The delivered costs of exports from Gulf Coast terminals to Northwest Europe during first-half 2016 were 5-10¢/gal more than Northwest European spot prices. At the same time, delivered costs of Gulf Coast propane exports were 6-13¢/gal less than naphtha spot prices in Rotterdam. Discounts for US NGLs vs. spot pricing for naphtha overseas became the most important factor supporting exports to Europe.
Delivered costs of Gulf Coast exports to markets in Asia Pacific were 3¢/gal more than spot regional naphtha prices in first-quarter 2016 before weakening to 5¢/gal less during second-quarter 2016. Gulf Coast exports increased to record-high volumes of 300,000-450,000 b/d in first-quarter 2016 and remained within this range during the second quarter.
Since prices did not support propane consumption in Northeast Asia's ethylene plants, exports were supported by other economics. Chinese petrochemical companies started up several propane dehydrogenation (PDH) plants in 2015-16. Because propane is the only feedstock for PDH plants, the key variable is pricing differentials between polymer-grade propylene and propane. Premiums for propylene vs. propane were 10-12¢/lb in during first-half 2016 and increased to 14-15¢/lb in the third quarter, which was strong enough to support Chinese PDH plant operations.
One threat to the surge in Asian demand for US propane, however, recently emerged. According to the Nuclear Energy Institute's website (www.nei.org), electric power producers in Japan restarted three nuclear power plants in third-quarter 2016. A fourth nuclear plant has been cleared for operation by regulatory authorities but remains offline due to opposition by antinuclear activists. As Japan increases electric power production from nuclear plants, Petral Consulting estimates demand for propane for BTU enrichment in gas-fired power plants will decline.
Outlook
Near-term trends in gas-plant NGL supply growth and pricing are functions of crude oil supply growth and pricing. The pause in supply growth for propane+, however, will limit the need for additional fractionation capacity. Many new raw-mix pipelines were designed to be expandable with extra horsepower, and these projects do not require much additional capital. Export terminals in the US Gulf Coast will have a combined capacity of 1 million b/d, but the exportable surplus available to Gulf Coast terminals will be only 600,000-700,000 b/d, leaving 300,000-400,000 of idle capacity at the terminals through 2020.
While reports suggest that Saudi Arabia and Russia may reach an agreement to freeze production, the Organization of Petroleum Exporting Countries' (OPEC) latest monthly oil market report shows Saudi Arabia actually increased crude oil production to 10.6-10.7 million b/d in July-August 2016, an increase of 500,000 b/d from the second quarter. Iranian crude oil production in July-August 2016 averaged 3.6 million b/d, or 540,000 b/d more than its second-quarter production. The combined increases from Saudi Arabia and Iran were about 1.4 million b/d.
According to OPEC statistics, Nigerian crude oil production was about 1.55 million b/d in second-quarter 2016, or 240,000 b/d lower than first-quarter 2016. The combined increases in production from Saudi Arabia and Iran were enough to offset both the decline in US production since second-quarter 2015 and the lower Nigerian production. Without these increases in Middle Eastern production, global oil supply and demand would be tighter, making benchmark oil prices probably $10/bbl higher than current pricing.
As of late September, OPEC had reached an agreement to freeze production, but specific quotas for each member country were not determined. Iraq immediately opposed the agreement based on concern that media sources understated its current production.
Petral Consulting previously expected prices for global crude oil benchmarks would remain in the range of $40-50/bbl during first-half 2016 and into second-half 2016 (OGJ, June 6, 2016, p. 62; Nov. 2, 2015, p. 70 ). A minor panic regarding US crude oil inventory and storage capacity sparked a sharp drop in crude oil prices in January-February 2016, but prices for West Texas Intermediate (WTI) and Dated Brent quickly rebounded to $40-45/bbl, eventually reaching $50/bbl in June. US crude oil inventory in commercial storage, however, is poised to increase to another new record high in first-quarter 2017, and Petral Consulting forecasts that downward pressure on WTI and Dated Brent will increase during fourth-quarter 2016 and first-quarter 2017. Prices may well fall as low as $30-35/bbl during first-quarter 2017 but will quickly rebound to $40-45/bbl in second-quarter 2017.
Until WTI prices are consistently $55-65/bbl and US crude oil production has resumed an annual growth rate of 350,000-500,000 b/d, US NGL production will remain within a range of 3.8-4.0 million b/d, leaving the industry with limited need, if any, to expand distribution and logistics system capacities, including those of export terminals.
Domestic demand for most NGL components will remain at current levels through yearend 2016 and into first-half 2017. Startup of the first of two 750-tonne/year PDH plants, which increased chemical feedstock demand for propane by 15,000-25,000 b/d in first-half 2016, will continue to boost propane demand in second-half 2016 to about 40,000-50,000 b/d.
Petral Consulting forecasts propane exports will stabilize at 550,000-600,000 b/d during second-half 2016, while waterborne ethane exports will increase to 100,000 b/d before yearend 2016. Butane exports, however, will remain within the established ranges of second-half 2015 and first-half 2016.
The author
Daniel L. Lippe ([email protected]) is president of Petral Consulting Co., which he founded in 1988. He has expertise in economic analysis of a broad spectrum of petroleum products includ-ing crude oil and refined products, natural gas, natural gas liquids, other ethylene feedstocks, and primary petrochemicals.
Lippe began his professional career in 1974 with Diamond Shamrock Chemical Co., moved into professional consulting in 1979, and has served petroleum, midstream, and petrochemical industry clients since. He holds a BS (1974) in chemical engineering from Texas A&M University and an MBA (1981) from Houston Baptist University. He is an active member of the Gas Processors Suppliers Association.