Refining capacity, catalyst market begin gradual recoveries in 2023
Ricardo Prada Silvy
Applied Science & Technology Consulting LLC
Norman, Okla.
Anticipated growth in post-pandemic global crude distillation capacity through 2027 is poised to strengthen demand for high-performance catalysts to accommodate accompanying capacity growth for downstream refining processes aimed at meeting demand for higher-value specialty products in line with a low-carbon future.
With pandemic-related lockdowns limiting demand for finished petroleum products globally in 2020-21, refiners began to reevaluate their conventional operations, paying particular attention to ways in which they could maximize the value of existing processes to increase near-term profitability amid then-massive demand cuts. While many operators opted to rationalize excess capacity, others turned to optimizing operations of select processes by investing in targeted catalysts aimed at ensuring maximum yields of varied, high-value, high-demand specialty products attainable from units already in place at their manufacturing sites.
Based on independent research and analyses of available capacity data as reported to OGJ’s annual worldwide refining survey and the Organization of the Petroleum Exporting Countries (OPEC), this article examines global refining operations during 2012-22 to establish future industry trends and the catalyst spending refiners will undertake as they boost downstream catalytic processing capacities in preparation for a cleaner, low-carbon future.
Applied Science & Technology Consulting LLC (AS&TC) estimates global crude distillation capacity will rise about 2.05% annually to 102.4 million b/d in 2027 from 92.5 million b/d in 2022, while global spending on refining catalyst will increase roughly 1.57% annually to about $8.49 billion by 2027 from about $7.85 billion in 2022 to account for accompanying capacity growth of the following catalytic processes during the same period:
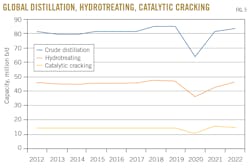
- Hydrotreating to 49.4 million b/d from 46.6 million b/d.
- Catalytic cracking to 15.8 million b/d from 15.0 million b/d.
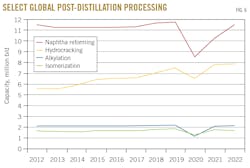
- Hydrocracking to 10.4 million b/d from 8.0 million b/d.
- Naphtha reforming to 12.3 million b/d from 11.5 million b/d.
- Alkylation to 2.3 million b/d from 2.1 million b/d.
- Isomerization to 2.1 million b/d from 1.7 million b/d.
Synergetic relationship
Refineries are increasingly prioritizing expansion of their upgrading capacity to meet growing demand for products in their respective regions. This is driven by several factors, including a mounting need for cleaner fuels such as low-sulfur gasoline and diesel, as well as rising demand for aromatics, olefins, and specialty products. To meet these demands, operators are focusing on expanding capabilities to convert heavy fractions such as residual oils that require more processing to produce lighter, higher-value products.
The requirements for cleaner gasoline and middle distillates—including diesel and jet fuel—contribute to increased demand for hydrodesulfurization and hydrocracking catalysts. These catalysts are essential for removing sulfur and other impurities from the fuel to improve its environmental performance.
Refineries are also seeking to enhance their profitability by increasing energy efficiency in process units via adoption of advanced technologies and optimization schemes to enable reduced energy consumption and operating costs.
Where possible, operators are also focused on ways to integrate traditional refining operations with petrochemical production, establishing closer connections between the refining and petrochemical sectors. By integrating operations, refiners can use existing refining processes to produce feedstocks for co-located downstream petrochemical plants, enabling expanded product portfolios and access to additional revenue streams. These trends collectively reflect the industry’s response to the evolving market demands and environmental regulations, as well as the desire to improve profitability and operational efficiency.
Technology advances are driving development of new refining catalysts that offer improved performance when processing heavy fractions under severe operating conditions. Increased development of these highly active catalysts promotes desired chemical reactions at faster rates, leading to higher conversion levels and improved product yields.
A crucial characteristic refiners seek in any catalyst is its resistance to deactivation, which occurs when the catalyst's activity decreases over time due to factors such as fouling, poisoning, or sintering. By developing catalysts that are more resistant to deactivation, refineries can extend the catalyst operating cycle to reduce frequency of catalyst replacement.
Advanced catalysts are designed to consume less hydrogen during the refining process. Hydrogen is a valuable resource in refining and petrochemical operations, and minimizing its consumption can lead to cost savings and more sustainable processes. By optimizing the catalyst formulation and structure, refineries can achieve higher hydrogen efficiency and reduce their overall hydrogen consumption. The enhanced activity, deactivation resistance, and lower hydrogen consumption of these new catalysts allow refineries to process larger volumes of petroleum fractions per unit cost of catalyst, resulting in improved economics and profitability.
Oil demand
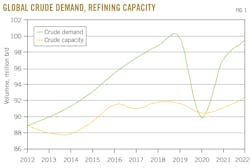
Between 2014-19, global oil demand grew at a rate of 1.8% annually, resulting in an increase of about 8.4 million b/d. During the same period, crude distillation capacity experienced a more modest growth of about 1.35 % annually, equating to an average annual capacity increase of about 1.1 million b/d. Regionally, the Asia Pacific and North America experienced the highest average oil demand growth. The COVID-19 pandemic in 2020, however, disrupted the oil market, leading to a sharp decrease in global oil demand to about 90.5 million b/d in 2020 from 99.8 million b/d in 2019. Oil demand began to recover after 2021, reaching 99.6 million b/d in 2022, growing at a rate of 4.5 million b/d annually (Fig. 1).

During 2012-20, the ratio of oil consumption to production capacity varied between 1.0 and 1.4, with an average ratio of about 1.025 (Fig. 2). In 2022, this ratio experienced a sharp increase to about 1.077, driven by accelerated industrial development in countries of the Asia Pacific.
Refining landscape
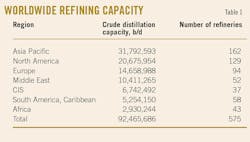
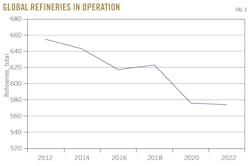
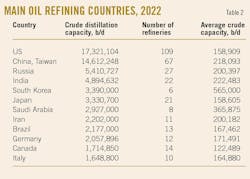
Currently, there are 575 active refineries in 107 countries, which process about 92.5 million b/d of crude oil (Fig. 3). Most of these refineries operate in the Asia Pacific and North America regions (Table 1). In 2022, both regions accounted for processing about 34.4% and 22.4% of global capacity, respectively. Processing by refineries in Europe and the Middle East accounted for about 15.9% and 11.2% of global capacity, respectively.
Catalyst market trends
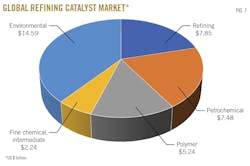
According to The Catalyst Group’s Intelligence Report 2022, the global catalyst market was estimated at about $34.5 billion in 2021, with a projected compound annual growth rate (CAGR) of 6.1% to reach about $49.3 billion in 2027. In 2022, the estimated catalyst market was $37.4 billion, distributed as:
- Refining, $7.85 billion.
- Petrochemicals, $7.48 billion.
- Polymers, $5.24 billion.
- Fine chemicals, intermediates; $2.24 billion.
- Environmental applications, $14.58 billion (Fig. 7).

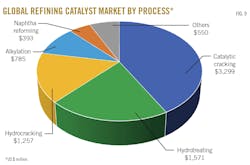
Catalytic processes account for about 95% of the total crude distillation capacity, with 17% for catalytic cracking, 53% for hydrotreating, 9% for hydrocracking, 13% for naphtha reforming, and 7% for other processes. Markets for catalytic cracking, hydrotreating, hydrocracking, alkylation, and naphtha reforming respectively account for about 42%, 20%, 16%, 10%, and 5% of the 2022 total refining catalyst market.
Future catalyst demand
AS&TC’s methodology for estimating the refining catalyst market by 2027 considers the following factors:
- Average increases in refining capacity for different catalytic processes from 2014-19 (Figs. 4-5).
- Projected additional refining capacity to be added between 2023-25.
- Historical behavior of the refining catalyst market.
New refinery construction or expansions of existing process units are underway. These developments will add about 5.8 million b/d in crude distillation capacity from 2023 to 2025. Out of this fresh capacity, about 1.17 million b/d will be from refineries integrated with petrochemical complexes that are now under construction in China, Egypt, and Russia.

According to AS&TC estimates, the refining catalyst market will reach $8.4 billion by 2027, with a yearly growth rate of 1.57% (Fig. 10). Catalyst markets for catalytic cracking, hydrotreating, hydrocracking, alkylation, naphtha reforming, and others will increase to $3.4 billion, $1.6 billion, $1.6 billion, $839 million, $427 million, and $589 million, respectively, by 2027.
Capacity trends
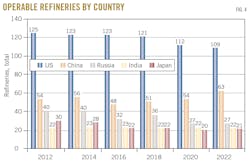
Tables 3 and 4 show the top 12 oil refining companies, their crude capacities, and number of active refineries in 2012 and 2022, respectively.


By 2022, Sinopec had claimed the top ranking, followed by ExxonMobil, CNPC, Saudi Aramco, and Marathon Petroleum Corp. (Table 4). Occupying the third position in 2012, Shell occupied the twelfth position in 2022 following sale or shuttering of 11 refineries. In contrast, MPC—which in 2012 held the twelfth position with six refineries—as of 2022 held the fifth spot with 13 refineries averaging capacity of about 222,923 b/d. Saudi Aramco's refineries for 2022 boasted the highest average crude distillation capacity at 365,875 b/d.
Sinopec, CNPC, ExxonMobil, Saudi Aramco, MPC, and Valero currently are the six companies with the highest number of refineries. Additionally, Saudi Aramco, ExxonMobil, Petróleos Mexicanos (Pemex), Sinopec, MPC, and National Iranian Oil Co. (NIOC) refineries feature the largest average crude capacities.
Sinopec expanded its crude processing capacity to about 5.6 million b/d in 2016 from just under 4 million b/d in 2012. During 2016-22, the operator’s average crude processing capacity was about 5.6 million b/d, with its number of oil refineries decreasing in 2020 to 24 from 27 in 2014.
ExxonMobil’s crude processing capacity was about 4.1 million b/d between 2012 and 2022, but its number of refineries decreased to 15 in 2022 from 18 in 2012.
CNPC increased its crude capacity to nearly 4 million b/d in 2022 from about 2.9 million b/d in 2020. Its total refinery count—with an average crude capacity of 186,968 b/d—rose to 21 in 2022 from 15 in 2020.
Saudi Aramco's refining capacity rose to about 2.9 million b/d in 2022 from 2.1 million b/d in 2012. With eight refineries, the operator maintains the largest average crude processing capacity at 365,875 b/d.
During 2012-22, Petróleo Brasileiro SA (Petrobras) increased its crude processing capacity by about 13% with 13 operational refineries, while Phillips 66 Co.’s refining processing capacity remained steady.
Following its 2022 acquisition of Shell’s interest in the 323,000-b/d refinery in Deer Park, Tex., Pemex’s total refining capacity rose 27% higher compared with 2012.
In 2022, MPC increased its overall crude distillation capacity to about 2.9 million b/d from about 1.3 million b/d in 2012. During the period, the operator lifted its total refinery count by seven to 13 in 2022 vs. its six refineries in 2012.

NIOC maintained an average crude processing capacity of about 2.1 million b/d across 14 refineries between 2016-19. Despite reducing its number of refineries to about 11, the operator increased total crude processing capacity to about 2.2 million b/d in 2022.
PJSC Rosneft Oil Co. gradually increased its crude processing capacity during 2012-22to 2.2 million b/d from 1.3 million b/d, while lifting its number of refineries to 12 from a previous nine.
Table 5 provides a list of the largest global refineries based on a crude oil processing capacity exceeding 400,000 b/d.
While Petróleos de Venezuela’s (PDVSA) Paraguana refining complex maintains the highest nominal distillation capacity at 940,000 b/d, its actual refining capacity is currently unknown following several accidents that have affected its operations. Meanwhile, South Korea’s SK Innovation Co. Ltd. and GS Caltex Corp., as well as the UAE’s Abu Dhabi Oil Refining feature refineries with capacities exceeding 800,000 b/d. Globally, there are three refineries featuring distillation capacities between 600,000-799,999 b/d, nine with 500,000-599,999 b/d, and 14 with 400,000-499,999 b/d.
Refining business trends
AS&TC has identified a series of major trends that will characterize the oil refining industry in the future as operators continue trying to meet demand for conventional transportation fuels and goods while simultaneously optimizing operations for long-term sustainability and profitability. These trends suggest:
- Continued volatility in crude oil prices due to external factors affecting industry operations will result in fluctuations in refinery margins and profitability.
- Growing refining capacity will be focused on sustainability and environmental, social, and governance considerations, stemming from increased efforts to reduce carbon footprints and promote circular economy practices.
- Reduced gasoline demand in developed countries due to factors such as: increased production of electric vehicles; development of more efficient fuel combustion engines that allow for less gasoline consumption per mile traveled; and continued enactment of stricter fuel economy standards.
- Increased demand for diesel and aviation fuel in emerging markets.
- Diversification of refinery operations into petrochemicals and other downstream industries to increase revenue margins.
- Greater integration between refinery and petrochemical complex businesses and operations.
- Expansion of renewable fuel production capacities via modification of existing units or grassroots construction.
- Consolidation of refining operations through mergers and acquisitions that will result in fewer but larger and more sophisticated refineries.
- Adoption of various commercial strategies to adjust processing capacities and configurations aimed at ensuring medium and long-term competitiveness in regional markets.
- Conversion of higher volumes of heavy and residual crudes to meet demand for fuels and products, as well as to increase refining margins considering price differentials compared to light crudes.
- Development of new, high-efficiency catalysts designed to remove sulfur, metals, and other contaminants from distillation fractions while consuming less hydrogen and achieving higher conversion and selectivity. The new generation of catalysts must process more refractory loads, be more resistant to deactivation, and process higher volumes of load per dollar of invested catalyst.
- Development of new reactors and catalytic processes that allow the conversion of heavy fractions to light fractions without producing residual coke. Through these new deep-conversion processes, a major decrease in the volumes of loads to be processed in thermal cracking units should be anticipated.
- Investment in new technologies to meet increasingly stringent environmental regulations in industrialized and developing countries. This includes carbon capture and storage and the production of blue hydrogen (derived from fossil fuels) or green hydrogen (derived from biological sources and renewable energy) to support the global transition to a low-carbon economy.
- Adoption of digital technologies and automation of process units to improve operational efficiency, reduce costs, and increase plant safety while minimizing potential environmental impact.
- Use of coke and other refinery waste in conversion processes for production of petrochemical feedstocks and other industrial uses.
The author
Ricardo Prada Silvy ([email protected]) is president of Applied Science & Technology Consulting Ltd. and chief technology officer at Chasm Advanced Materials Inc. With more than 30 years’ industry experience, he has held leadership and technical management positions at Petróleos de Venezuela SA, Southwest Nanotechnologies, Nanocyl SA, and The Procter & Gamble Co. He also served as a consultant in the field of gas-to-liquid technology for Petroleo Brasileiro SA’s Leopoldo Américo Miguez de Mello Research, Development and Innovation Center. Silvy holds a BS (1981) in chemistry and chemical engineering from Universidad Central de Venezuela (UCV) and both an MS (1984) and PhD (1987) in catalysis and material science from Université Catholique de Louvain, Belgium. He is an affiliate lecturer at the University of Oklahoma and an expert in carbon nanotube synthesis, as well as hydrotreating and hydrocracking catalytic processes.