Pandemic, geopolitical tensions pose barriers to US olefins export market
Dan Lippe
Petral Consulting Co.
Houston
Concerns regarding the surge in coronavirus (COVID-19) infections worldwide due to the Delta, Lambda, and Omicron variants, amid escalating global geopolitical tensions that began second-half 2021, kept US Gulf Coast (USGC) ethylene producers vigilant during the first months of 2022 as they weighed potential impacts on expectations for rebounding supply and export levels.
Although the pandemic previously had limited direct impact on the US petrochemical industry, it was the major cause of global supply chain problems, measurably impacting both production and exports of ethylene, propylene, and butadiene, as well as first- and second-tier derivatives.
While growing geopolitical problems and unpredictable weather-related impacts could translate into increased pricing volatility for crude oil and related products, further complicating near-term predictability of the US petrochemicals market, the persisting pandemic’s potential impact on refinery operations and by-product supply of propylene, butylene, and benzene will remain the primary source of uncertainty for USGC olefins producers. The combination of these and other factors, casts more uncertainty over the outlook for 2022-23 than was the case 6 months ago.
Pandemic, weather-related impacts
A basic review of US refining and ethylene 2020-21 operating trends supports the conclusion that the COVID-19 pandemic had a far more negative impact on domestic refining operations than on the US olefins industry, evidenced by the recovery of merchant refinery propylene sales to prepandemic levels well before refinery operating rates.
Operating rates of all US refineries averaged 70-80% in 2020 through first-quarter 2021 before improving to 85% in second through third-quarter 2021.
Other measures of the pandemic’s impact on the US refining industry include production of, domestic demand for, and export of transportation fuels. In second-half 2021, production from all US refineries totaled 15.85 million b/d, down 7.5% from second-half 2019. During the same period, domestic demand stood at 14.8 million b/d (4.5% less), with exports totaling 2.15 million b/d (down 14.5%).
More important than overall US operating rates, however, are operating rates for USGC and Midcontinent refineries, as these account for 90-100% of refinery propylene supply for USGC chemical markets.
With the pandemic’s onset, USGC refiners maintained FCCU operating rates, increased operational severity to adjust to collapsing jet-fuel demand, and reduced operational severity for catalytic reformers. Based on these adjustments—and despite second-half 2021 refinery crude runs remaining 618,000 b/d (4.9%) less than in 2019—refinery propylene supply in 2021 reached its second-highest level in the past 8 years and was just 0.8% lower than 2019.
US ethylene plants operated at rates of 80-88% across 2020 for a full-year average operating rate of 86%, down from 88% in 2019. In 2021—excluding widespread downtime in February-March caused by an unprecedented winter deep freeze and subsequent power outages—full-year operating rates averaged 93%, fluctuating between 90-92% during the first, second, and third quarters. And whereas second-half 2021 refinery crude runs were down about 5% from 2019, US ethylene production was 9% higher at 17 million lb/day.
Despite the boost in ethylene production, second-half 2021 polyethylene exports to destinations other than the western hemisphere were 11 million lb/day (39%) lower from 2019. Exports of ethylene glycol in January-November 2021 totaled 8 million lb/day.
Although US ethylene producers experienced less weather-related interruptions than in 2020 and first-quarter 2021, second-half 2021 was not all smooth sailing. Hurricane Ida’s late-August 2021 landfall in southeast Louisiana led to extended outages to regional power supply that forced ethylene plants and refineries throughout the New Orleans-area Mississippi River corridor (NORC) into several weeks of downtime.
Southeast Louisiana is home to eight ethylene plants with a combined capacity of 14 billion lb/year. While five plants are equipped with the flexibility to consume the full range of feedstocks (ethane, propane, normal butane, light naphtha), three plants—with a combined capacity of 4.2 billion lb/year—have limited feedstock flexibility. Two of these plants are entirely dependent on a feedstock of purity ethane, with the third able to consume both ethane and propane. All eight ethylene plants in southeast Louisiana were out of service for at least 3 weeks following the hurricane’s landfall. Five plants with a combined capacity of 9 billion lb/year resumed operations in the last 10 days of September, with another plant unable to resume operations until mid-October. Two units remained offline until January 2022.
During the 4 months preceding Hurricane Ida, ethylene production in the NORC was 32-37 million lb/day for a total May-August 2021 production of 4.3 billion lb. Production in September-December 2021 totaled 2.5 billion lb, a 1.8-billion lb drop. This was the second consecutive year downtime caused by hurricanes left Lousiana’s ethylene production lower in the second half of the year than the first.
Global turmoil, products pricing
To kick off crude trading and pricing trends in 2022, Russia continued to amass troops and tanks along Ukraine’s entire 2,100-mile border with Russia and Belarus. While a Russian invasion of Ukraine could impact Middle Eastern crude production, Ukraine itself remains a major gateway for Russian and Kazak crude supplies into eastern Europe, including Slovakia, Hungary, and the Czech Republic. Ukraine’s natural gas transmission system also delivers gas from Russia and Belarus to consumers in Poland, Romania, Moldova, Hungary, and Slovakia.
In July 2021, prices for international benchmark West Texas Intermediate (WTI), Brent, and Organization of Petroleum Exporting Countries (OPEC) Reference Basket (ORB) crudes were $72-75/bbl, up from $52-54/bbl in January 2021. OPEC+ fulfilled its commitment to increase monthly production by 400,000 b/d and extended this commitment into first-half 2022. Middle Eastern OPEC producers alone increased production by 2.6 million b/d in second-half 2021, while production from OPEC members in Africa remained constant.
US oil producers increased drilling activity steadily in 2021. US Energy Information Administration (EIA) statistics showed US production was 11.8 million b/d in December, up 1.1 million b/d from first-quarter 2021. The combined increase in 2021 oil production from Middle Eastern and US producers was 3.5-3.6 million b/d.
Statistics to prove or disprove the perception that global crude oil supply did not keep pace with rising crude oil demand will not be available until second- or third-quarter 2022. Preliminary data from the Joint Oil Data Initiative (JODI) showed crude runs from refineries in Europe, North America, the Asia Pacific, India, Africa, the Middle East, Russia, and South America in April-August 2021 were 1.3-1.6 million b/d higher from the same period in 2020. During the same timeframe, oil production from key OPEC and North American producers rose 2.2 million b/d from the previous year. Based on OPEC’s Monthly Oil Market Report (MOMR), production from OPEC Middle East member countries in September-November 2021 was up 1.7 million b/d from 2020. On the demand side, EIA data showed US crude runs in fourth-quarter 2021 were down 600,000 b/d from the previous quarter but were 1.5 million b/d higher from fourth-quarter 2020.
Short-term perceptions often have greater influence on prices and, as such, remain more important than statistical data. During the period of rising production and lagging demand recovery in 2021, WTI and ORB prices varied within a range of $60-75/bbl and $63-75/bbl, respectively. The sustained increase in oil prices that began in December 2020 ended in November-December 2021 when benchmark prices declined by $6.50-8.50/bbl (8.0-10.5%). Developments in Ukraine and escalating attacks by Houthi rebels in Yemen were sufficient to erase the bearish influence of rising crude oil supply in excess of recovery in global refinery crude runs.
As tension levels between Russia and US-European governments escalated, buyers and traders ignored bearish supply-demand considerations, ushering crude prices to $86-90/bbl in mid to late-January 2022. If oil prices increase 5%/month in February-March 2022, benchmarks will pierce the magic $100/bbl level before the end of the first quarter.
For North American ethylene producers, however, rising prices for important feedstocks (propane, butane, naphtha) are hardly problematic, as expansion projects executed during the previous 7 years were designed for a feedstock of purity ethane. Notwithstanding potential pandemic and weather-related interruptions, US ethylene producers should be able to look forward to at least another 3 years of expanding ethylene production and increasing exports of key derivatives based on their sustained cost advantage for all ethane-based plants.
US capacity expansions, plant startups
As of Jan. 1, 2021, US nameplate ethylene capacity was 86.5 billion lb/year (237 million lb/day). With a few producers in early 2021 deciding to take surplus capacity offline indefinitely amid the ongoing pandemic, capacity stood at 84.7 billion lbs (232 million lbs per day) on July 1, 2021. One Texas plant was restarted in October 2021, and another plant in Lake Charles, La., resumed operations in November 2021. While none of the three new US plants under construction achieved sustained ethylene production during second-half 2021, all were reported to be mechanically completed and at some stage of incremental production by yearend 2021. Based on plants in operation, US production capacity was 87.4 billion (239.5 million lb/day) in December 2021.
All three new US plants, however, will likely reach full capacity in first-half 2022, including:
- Saudi Arabian Basic Industries Corp. (SABIC) and ExxonMobil Corp.’s 50-50 joint venture Gulf Coast Growth Ventures LLC’s (GCGV) 1.8-million tonne/year (tpy) ethane cracker in Portland, San Patricio County, Tex., near Corpus Christi.
- Shell PLC subsidiary Shell Chemical Appalachia LLC’s Shell Polymers Monaca site, which includes a dual 1.5-million tpy ethylene and 1.6-million tpy polyethylene complex just southwest of Monaca, Pa., along the Ohio River in Potter and Center Townships, Beaver County, 30 miles northwest of Pittsburgh.
- Borealis AG and TotalEnergies SE’s 50-50 joint venture Bayport Polymers LLC’s (Baystar) 1-million tpy ethane steam cracker at TotalEnergies Petrochemical & Refining USA’s 200,000-b/d integrated refining complex in Port Arthur, Tex.
Collectively, these three plants will increase US nameplate capacity to 97 billion lb (266 million lb/day). Texas capacity will reach 66.7 billion lb (182.7 million lb/day), while Louisiana capacity will remain at 24.5 billion lb (67 million lb/day). US Midcontinent capacity will increase to 6 billion lb (16.4 million lb/day).
Ethylene production
Petral Consulting Co. tracks US ethylene production via a monthly survey of operating rates and feed slates. Plants in the Houston Ship Channel and Orange, Tex., and Beaumont-Port Arthur, Tex. areas are substantially interconnected by pipeline with Louisiana plants, but Texas plants rarely run at higher rates to make up for downturns in Louisiana production when those plants experience extended downtime. Individually, chemical companies operate ethylene plants to meet the needs of their own derivatives units and have limited surplus ethylene supply to sell when Louisiana plants experience downtime.
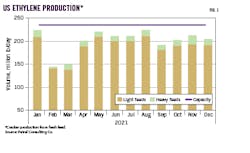
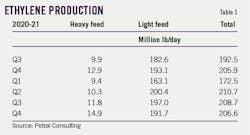
In second-half 2021, US ethylene producers quietly celebrated the best consecutive quarterly production rates on record. Total US production during the last 6 months of 2021 totaled 38.2 billion lb, up 3.4 billion lb (9%) from 2019 and 1.6 billion lb (4.3%) from 2020 (Table 1). US plants operated at 90% capacity in third-quarter 2021 and 88% capacity during the fourth quarter.
Ethylene production from Texas plants in second-half 2021 was 28 billion lb, up 5.4 billion lb (23.6%) from first-half 2021, 3.6 billion lb (14.7%) higher from 2019, and 2.4 billion lb (9.3%) more than in 2020. While cold weather and power outages in February 2021 restricted Texas production for 75-90 days, weather caused no widespread downtime in second-half 2021.
Second-half 2021 ethylene production from Louisiana plants was 8.7 billion lb, down 610 million lb (6.6%) from 2019 and 800 million lb (8.5%) less than in 2020.
Fig. 1 shows recent trends in ethylene production.
Ethylene production costs
Ethylene production costs are determined by raw material costs and coproduct credits. Based on variations in yield patterns for the various feeds, coproduct volumes range widely between the three categories of plants (ethane-only, LPG-only, and multifeed plants). Of these three categories, only producers with multifeed plants actively manage the mix of feeds in response to changes in variable production costs for ethane, propane, and heavy feeds.
Raw material costs are determined by each feedstock’s price and its conversion to ethylene. Similarly, coproduct credits are determined by spot prices and production volumes for each coproduct but only for those plants that upgrade all coproduct streams to meet purity specifications.
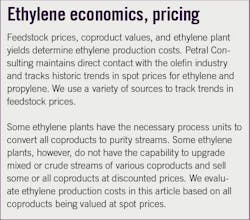
A few ethylene plants can upgrade all coproducts to purity streams and sell all coproducts at market prices. Most ethylene plants produce purity coproduct propylene but produce all other coproducts as mixtures (mixed butylene-butadiene and mixed aromatics) and sell mixtures at discounted prices. Variations in realized revenue for coproducts result in large differences in coproduct credits from one plant to another. Cash production costs are determined by simple addition of raw material costs and coproduct credits (see accompanying box).
Crude oil prices greatly influence prices (directly or indirectly via the value of one feedstock as a substitute for another) for most feedstocks and coproducts and are especially important as the primary driver for naphtha, propane, normal butane, propylene, and aromatics.
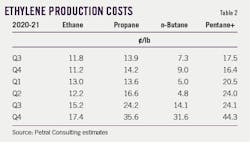
Despite volatility in crude and refined-product pricing by yearend 2021, USGC ethylene producers continued to enjoy plentiful ethane supplies, relatively stable production costs, and consistent cost advantages relative to propane and naphtha. In second-half 2021, daily US ethane-based ethylene production costs were 14-19¢/lb to average 16¢/lb, which was 12-13¢/lb less than propane-based production costs of 16-37¢/lb and natural gasoline-based production costs of 12-40¢/lb during the same period (Table 2).
Ethane accounted for 80-83% of US ethylene production in second-half 2021, delivering US ethane-based producers a nearly $5-billion cost advantage relative to other feedstocks. Clearly, the global olefins industry’s interest in building new capacity based on US ethane imports is supported by favorable economics, and the USGC—for all its weather-related issues—remains the best place to build such capacity.
Petral Consulting routinely estimates ethane rejection volumes. In first-half 2021, ethane rejection for low-cost basins (Kansas-Oklahoma, New Mexico, Texas) was 340,000-420,000 b/d but slipped to 340,000-385,000 b/d in second-half 2021. Lower ethane rejection during second-half 2021 was accompanied by a 130,000-140,000 b/d increase ethane recovery during the period.
When ethane is rejected, it is gone forever. When too much ethane is produced, it accumulates in storage and serves the important purpose of extending the period of stable ethane prices. Based on 340,000-410,000 b/d of ethane rejection in low-cost basins through yearend 2021, USGC ethylene producers continue to have sufficient ethane availability to accommodate demand from existing plants in 2022-23 and meet rising demand when production from the Baystar and GCGV plants reach full operating rates in early 2022.
Ethylene pricing, profit margins
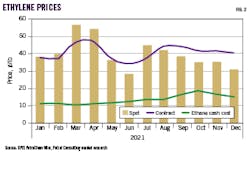
Spot ethylene prices at Enterprise Products Partners LP’s USGC hub in Mont Belvieu, Tex., fell from a high range of 50-60¢/lb in March-April 2021 to 28¢/lb in June before jumping to 50-55¢/lb by mid-July, when prices at Louisiana’s ethylene hubs of Choctaw Dome and Sulfur also rose to 55-60¢/lb.
The price spikes occurred amid minor operating problems at two Texas plants, with one plant out of service for a planned turnaround. During the same period, another plant in Louisiana also experienced about 10 days of unplanned downtime. The combination was sufficient to double spot prices compared with the June average. The mid-July outages were followed by the late-August arrival of Hurricane Ida, which caused extensive damage to southeast Louisiana’s electric power grid and reduced regional ethylene capacity to only 14-15% of nameplate capacity. Three plants in the New Orleans area remained offline through October, with downtime at two other Louisiana plants extended through yearend.
Spot ethylene prices in Texas were 38-50¢/lb in August 2021 before slipping to 35-38¢/lb in September, with prices in Louisiana peaking at 55-60¢/lb in early September before falling to 45-50¢/lb during the last 2 weeks of the month. Louisiana production rates during second-half 2021 remained well below peak volumes of 62 million lb/day in December 2020 and 60 million lb/day in first-quarter 2021. US polyethylene exports, however, also declined in second-half 2021, offsetting Louisiana production losses in the fourth quarter.
Texas ethylene prices hovered in a 30-35¢/lb range during fourth-quarter 2021, but prices in Louisiana maintained premiums of 3-7¢/lb in October-November before falling to parity with Mont Belvieu pricing in December.
While spot-market ethylene prices generally exaggerate impacts of unplanned downtime at production plants, pricing in second-half 2021—especially during September-December—was an exception to this rule of thumb. In August-December 2021, net transaction prices (NTP) jumped to 44.25¢/lb and remained above 40¢/lb across the fourth quarter, with Mont Belvieu spot prices holding at discounts of 5-9¢/lb to NTPs.
An important pricing variable in ethylene supply contracts and the primary consideration for internal-transfer price agreements, NTPs result from extensive negations between a group of producers and buyers and are frequently settled retroactively. From this perspective, NTP prices are usually more important than spot prices. During fourth-quarter 2021, NTPs became even more important despite major Louisiana production losses in September-December.
During second-half 2021, profit margins based on NTPs and cash costs for ethane remained above 25¢/lb but never exceeded 35¢/lb, even as tight LPG supply in the Middle East pushed international and domestic LPG prices to levels which chemical feedstock buyers in the Asia Pacific and Europe had not seen since second-half 2014.
Propane-based profit margins were 24¢/lb in third-quarter 2021 before falling to 10-12¢/lb in October- November and recovering to 15-16¢/lb in December. Margins for light naphtha and natural gasoline reached a high of 38¢/lb in August 2021 before collapsing during the fourth quarter to 5-10¢/lb.
Fig. 2 shows historical trends in ethylene prices (spot, NTPs) and ethane production costs.
Olefin-plant feed slate trends
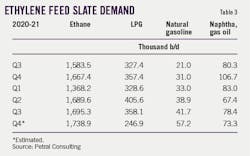
Petral Consulting’s monthly survey of plant operating rates and feed slates showed US industry demand for light feedstocks (ethane, propane, and normal butane) was 2.00-2.10 million b/d in second-half 2021, 130,000 b/d less than demand in first-half 2021. Light feed demand peaked in August 2021 at a new record high of 2.2 million b/d, with the second-half 2021 demand low of 1.87 million b/d occurring in September.
Total US ethane demand slipped from a monthly high of 1.83 million b/d in August to a low of 1.64 million b/d in September. Total second-half 2021 US demand for ethane was 1.72 million b/d, up 190,000 b/d from first-half 2021, with ethane representing an 80% share of fresh feed demand during second-half 2021 compared to its 76% share in the first 6 months of the year.
In fourth-quarter 2021, US ethylene producers reduced demand for LPG feeds to 235,000-255,000 b/d from 480,000-500,000 b/d in July. Consistent with plant downtime in southeast Louisiana caused by Hurricane Ida, LPG demand fell to lows of 215,000-225,000 b/d in September. LPG represented a 17% share of fresh feed demand in third-quarter 2021 before falling to a 12% share in the fourth quarter due to a surge in spot pricing for propane and normal butane as well as declining profit margins September-December.
US demand for natural gasoline, light naphtha, and other heavy feeds during second-half 2021 varied within a range of 110,000-140,000 b/d, with demand at the lower end of that range in July and September and at the higher end during August, October, and November. If all Louisiana plants’ heavy feed capability had been operational in September-December, second-half 2021 demand for heavy feeds would have been 130,000-175,000 b/d. Reduced heavy feed demand during the period likewise impacted total ethylene coproducts supply, particularly that of butadiene and aromatics.
Table 3 shows trends in ethylene feedstock demand.
Ethylene, polyethylene exports
US ethylene producers generally operate to meet daily, weekly, or monthly sales volumes of mainstream derivatives, with polyethylene the most important global commodity for USGC producers. As a solid, polyethylene pellets are shipped in bulk via container vessels. Ethylene glycol, a liquid, is also an important derivative for the global ethylene market. As such, trends in international trade are also an important element of this article series.
US ethylene exports began gradually increasing during first-half 2020 with the opening of Enterprise Products Partners and Navigator Holdings Ltd.’s jointly held marine export terminal at Morgan’s Point, Tex., along the Houston Ship Channel, and have since grown exponentially. According to US International Trade Commission (US ITC) data, ethylene monomer exports were 5.1 million lb/day in second-half 2020, slipped to 3.2 million lb/day in first-half 2021, and increased to 4 million lb/day in third-quarter 2021. Petral Consulting estimates monomer exports increased to a record high of 5.8-6.2 million lb/day in fourth-quarter 2021. While sustained increases in ethylene monomer exports were 1.4-4.5 million lb/day more than in 2018-19, the increases represented only 0.7-2.0% of total US ethylene production.
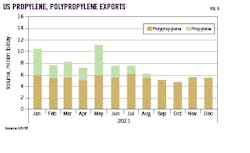
In contrast to exports of ethylene monomer, propylene monomer exports are not limited by specially designed cryogenic storage tanks and terminals. Instead, propylene monomer exports share capacity with propane and butane at various USGC export terminals. While LPG exports reached record-high levels in second-half 2021, propylene monomer exports fell sharply during the same period, slipping to below 1 million lb/day in October-November.
In July 2021, US ITC showed propylene monomer exports jumped to 5.3 million lb/day before falling to 1.84 million lb/day in August and 1.42 million lb/day in September. While Mexico and Colombia remained the primary destinations for propylene monomer exports through July 2021, exports to Colombia fell to zero in August and remained less than 1 million lb/day in September-November.
While Petral Consulting has consistently recognized that the pandemic had a sustained impact on global demand for transportation fuels, the slump in demand for gasoline, diesel, and jet fuel remained of limited consequence for producers of primary olefins. Polyethylene exports, however, have been critical to profitability for all US ethylene and polyethylene capacity that came on stream 2017-19 and will remain so for new plants scheduled to come online in 2022.
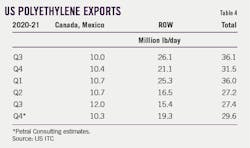
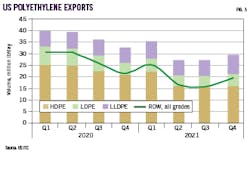
The most alarming development for US ethylene producers during 2021 was the sustained decline in polyethylene exports. According to US ITC data, US exports to all destinations (ROW; destinations outside North America) rose from 37-40 million lb/day in second-half 2019 to reach 42.7 million lb/day in February 2020 and 44.1 million lb/day in June 2020. The decline in polyethylene exports began in second-half 2020, when exports plateaued at 27 million lb/day, down 12.6 million lb/day (31.6%) from first-half 2020.
As noted in recent analyses of olefins market trends, polyethylene exports to ROW destinations are an important indicator of the USGC olefins industry’s health. USGC exports to ROW destinations in first-half 2020 were about 30.2 million lb/day before falling 14.2 million lb/day (47.4%) to 16 million lb/day in second- and third-quarters 2021.
Fig. 3 shows US exports for the three primary grades of polyethylene. Table 4 shows polyethylene exports by destination.
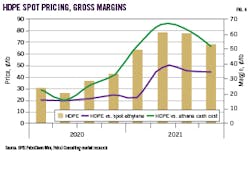
The supply chain margin (polyethylene price minus ethylene production cost) is one of the best indicators of profitability for the many producers who are vertically integrated and produce ethylene to feed their own derivatives plants. High-density polyethylene (HDPE)-ethane margins were 30-35¢/lb in fourth-quarter 2020 before increasing to 65-70¢/lb in second and third-quarters 2021 and slipping to 52¢/lb in the fourth quarter. Before 2020-21, margins for HDPE exports were at premiums of 15-30¢/lb to cash production costs for purity ethane.
In June-July 2021, HDPE spot prices increased, with margins based on ethane cash costs jumping to 22-23¢/lb. As HDPE export pricing continued to strengthen, margins based on ethane cash costs rose to 31-33¢/lb in October-November and reached 34-35¢/lb in December.
Second-half 2021 US ethylene supply (production minus change in inventory, exports) was about 316 million lb more than in second-half 2020, with US polyethylene exports down by 1.1 billion lb during the period. HDPE export pricing and ethylene prices in 2021 were up 25-40¢/lb and 15-30¢/lb, respectively, from second-half 2020, suggesting US domestic demand for polyethylene also increased in 2021.
The rebound in polyethylene prices and gross margins remains a favorable short-term indicator for USGC integrated ethylene producers.
Fig. 4 shows pricing and margin trends for HDPE.
Propylene supply, distribution
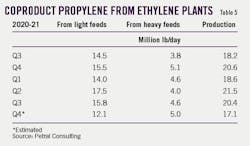
Coproduct propylene supply depends primarily on the use of propane, normal butane, naphtha, and other heavy feeds. In second-half 2021, monthly survey results showed USGC plant demand for LPG feeds (propane, normal butane) was 302,000 b/d, with demand for heavy feeds at 127,000 b/d. Combined demand for LPG and heavy feeds was 430,000 b/d, accounting for 20.1% of fresh feeds to regional plants. If hurricanes had not caused 120 days of downtime for two of southeast Louisiana’s multifeed plants, second-half 2021 demand for heavy feeds would have been 30,000-35,000 b/d higher than first-half 2021, though total demand for LPG and heavy feeds still would have remained below combined demand during the previous 6-month period.
Total coproduct propylene supply from all USGC plants was 17.3 million lb/day in third-quarter 2021 before dropping to 13.6 million lb/day in the fourth quarter to average 15.5 million lb/day for second-half 2021. This was 18.1% less than the coproduct propylene supply of 18.9 million lb/day during first-half 2021.
Table 5 shows Petral Consulting’s estimates of coproduct propylene supply.
Refinery propylene sales into the merchant market are a function of:
- FCCU feed rates (most important variable).
- FCCU operating severity (important but not directly measurable).
- Economic incentive to sell propylene rather use it as feed to alkylation units.
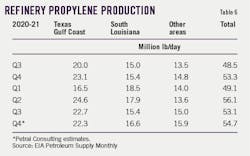
Seasonal variations in refinery operating rates directly influence FCCU feed rates, and the combination of feed rates and operating severity are the most important factors determining variations in refinery-grade propylene supply. USGC and Midcontinent refineries account for 95% (or more) of refinery propylene supply for USGC propylene consumers.
Pandemic-related restrictions continued to weigh on demand for finished transportation fuels during second-half 2021, which in turn influenced refinery operations in general and FCCU operations particularly.
Crude runs at USGC and Midcontinent refineries averaged 12.1 million b/d in third-quarter 2021, or 1.27 million b/d (10.3%) higher from third-quarter 2020, and 12.0-12.2 million b/d in fourth-quarter 2021, which was up 1.9 million b/d (10.9%) from the last quarter of 2020. Feed rates for FCCUs at USGC and Midcontinent refineries in third-quarter 2021 were 3.48 million b/d and 3.40-3.45 million b/d in the following quarter. While third and fourth-quarter 2021 FCCU feed rates climbed 7.1% and 10.6%, respectively, from their respective quarters in 2020, the 2021 quarterly FCCU feed rates remained 4.9% and 4.3% less relative to the prepandemic third and fourth quarters of 2019. At the same time, FCCU feed rates during third and fourth-quarters 2021 respectively accounted for 28.7% and 28.4% of combined USGC and Midcontinent crude runs.
Ahead of the pandemic, US jet fuel demand was 1.75 million b/d with average exports of 226,000 b/d. Jet fuel demand hit its lowest point of 691,000 b/d in second-quarter 2020. Jet fuel exports also fell sharply during second and third-quarters 2020 to 44,000 b/d, which was 80% below prepandemic volumes. In second-quarter 2020, jet fuel production accounted for just 4.7% of total crude runs compared to 11% in fourth-quarter 2019. Using 11% as the basis, the volume of jet fuel fractions that were blended into the distillate fuel oil pool were 700,000-830,000 b/d in second and third-quarters 2020.
Even though jet fuel demand began slowly recovering in third-quarter 2020, second-half 2021 demand remained 250,000-350,000 b/d below 2019 levels, with refiners continuing to divert jet fuel fractions into the distillate and motor gasoline pools as feed to FCCUs. Furthermore, to offset reduced crude runs, many refiners increased FCCU operating severity, which increases yields of gasoline blendstocks and light olefins by-products but decreases yields of diesel fuel components.
The year-over-year comparisons in refinery crude runs and FCCU feed rates are important in analyzing trends in refinery-grade propylene sales in second-half 2021. Refinery-grade propylene supply from USGC and Midcontinent refineries was 49.4 million lb/day in third-quarter 2021 and 49.3 million lb/day in the fourth quarter. While merchant propylene sales in third-quarter 2021 were up 4.3 million lb/day (9.4%) from the same period in 2020, year-over-year improvement slowed to 0.9 million lb/day (1.9%) in fourth-quarter 2021.
Increased merchant propylene sales during third and fourth-quarters 2021 resulted from cumulative effects of higher FCCU feed rates and higher severity operations. As light olefins yields increased, refiners filled alkylation units with FCCU butylenes. With little or no spare capacity for propylene and left with few economic options, USGC refiners increased merchant sales of refinery propylene.
As demand for jet fuel continues gradually recovering and domestic demand for diesel fuel remains on the uptick, refiners will, at some point, revert to prepandemic operating conditions. Until such time, merchant sales of refinery propylene from USGC refineries will show no signs of growth and could even decline in second-half 2022 and 2023.
Table 6 shows the geographic distribution of US refinery propylene supply.
Propylene exports
While propylene monomer is easier to export than ethylene monomer, US propylene producers have always been able to expand derivatives capacity fast enough to limit the need for propylene monomer exports. Even as chemical companies moved aggressively to expand exports of polyethylene and other ethylene derivatives to markets in every corner of the globe, they did not expand the geographic scope of exports for propylene monomer or propylene derivatives. In fact, quite the opposite occurred. As ethylene producers revamped existing plants to increase ethane-cracking capability, propylene coproduct supply declined. Imports of propylene monomer (primarily from Canada) were constant during 2014-18 but declined by 50% in 2019 when Nova Chemical Corp. completed converting its naphtha cracker at Sarnia, Ont., to 100% ethane feed.
US polypropylene exports also declined gradually, but polypropylene imports (0.5-0.7 million lb/day in 2010-13) tripled in 2014-16 to reach 1.4-1.8 million lb/day until 2021, when US producers responded to sustained high prices in the domestic market by increasing imports to 2.4 million lb/day.
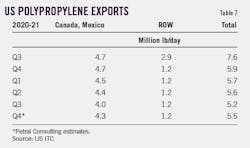
In 2005-11, US polypropylene exports to all destinations hovered between 7-9 million lb/day and fell to 5-7 million lb/day in 2017-21. US olefins producers have yet to go global with polypropylene exports, with destinations in Canada and Mexico accounting for 78% of all exports since second-quarter 2020.
Table 7 shows recent trends in US polypropylene exports by destination. Fig. 5 shows US exports of propylene monomer and polypropylene in 2021.
Propylene economics, pricing
In second-half 2021, unleaded regular gasoline prices in the USGC varied within a range of 210-230¢/gal (34-36¢/lb) except in October. Using unleaded regular gasoline prices (¢/lb) as the independent value basis, refinery-grade propylene prices for supply delivered via pipeline to Mont Belvieu varied within a very narrow range of 23-24¢/lb, according to OPIS PetroChem Wire. Refinery propylene prices were at discounts of 10-14¢/lb to unleaded regular gasoline in third and fourth-quarters 2021 compared to premiums of 11-13¢/lb in January-February 2021.
Before second-quarter 2021, refinery propylene prices for supply delivered via pipeline usually mirrored unleaded regular gasoline prices (¢/lb basis), ± 1-2¢/lb. While deepening discounts for refinery propylene relative to unleaded regular gasoline are puzzling, even more puzzling is the widening spot-market price differential between refinery propylene delivered by pipeline relative to supply delivered via rail, which OPIS PetroChem Wire also tracks. In 2020, prices for rail deliveries were consistently 3-7¢/lb higher than product delivered by pipeline to Mont Belvieu. In first-half 2021, premiums jumped to 20-23¢/lb before increasing to 20-40¢/lb during second-half 2021 until December, when they slipped to 16.5¢/lb.
Two economic factors are the primary drivers for polymer-grade propylene prices. The cost of upgrading refinery propylene via propane-propylene fractionation units (commonly known as PP splitters) is a well-established driver. A few companies control merchant fractionation capacity for upgrading refinery propylene to polymer-grade quality. Based on 36 months of historical prices and pricing differentials, the usual price to upgrade refinery propylene to polymer-grade propylene is 12-15¢/lb. Polymer-grade propylene premiums to refinery-grade propylene were 15-16¢/lb in first-half 2020 before increasing to 18-19¢/lb (+17.5%) in second-half 2020.
The conversion cost of propane to propylene via a dehydrogenation unit is another important price driver for polymer-grade propylene. Propane is a PDH plant’s major cost, and PDH plant process economics vary directly with propane prices. As Middle Eastern producers implemented deep cuts in crude oil production, gas-plant propane supply declined, causing international market balances to gradually tighten. Since propane consumption is concentrated in the northern hemisphere, colder weather boosted space-heating demand, adding to bullish influences on propane prices.
Prices for stored propane at Mont Belvieu were 20-24¢/lb in first-half 2021 before increasing to 25-27¢/lb in the third quarter and 30-33¢/lb in September-October. Polymer propylene premiums to propane were 50-55¢/lb in May-July 2021, peaking at 65¢/lb in August before weakening to 25-35¢/lb in the fourth quarter.
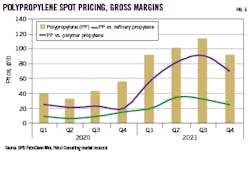
Contract prices for polymer-grade propylene were 70-80¢/lb in May-July 2021, 87¢/lb in August, and remained at 70-75¢/lb until December. When contract prices settled at 56¢/lb in December 2021-January 2022, gross margins for PDH plants once again were in their historic range of 18-25¢/lb. The strength in polymer propylene prices gained support from persistently strong polypropylene prices. From March-October 2021, spot prices for injection-grade homopolymer polypropylene were 100-117¢/lb, with gross margins of 25-35¢/lb relative to polymer propylene compared with historical gross margins of 0-10¢/lb.
Fig. 6 shows trends in polypropylene differential pricing vs. spot pricing for refinery and polymer-grade propylene.
2022-24 outlook
The critical objective for USGC ethylene producers is to continue increasing exports of polyethylene, ethylene glycol, and other ethylene-based products to ROW destinations. Gross margins for HDPE (FOB Houston pricing) based on ethylene production costs from purity ethane have remained very strong relative to recent historic levels. Unless domestic polyethylene fabricators continue to take market share and domestic demand continues to increase, rising polyethylene production from new US plants scheduled to reach full capacity in 2022 will increase downward pressure on export prices until export demand begins to recover. Similarly, supply chain disruptions have contributed to unusual strength in polypropylene prices, propylene prices relative to PDH plant costs, and wider premiums for refinery-grade propylene delivered by rail relative to supply delivered via pipeline.
The next 18-24 months will be a period in which olefins and polyolefins markets return to prepandemic trends. Resistance to government lockdown mandates and other regulatory intrusions into everyday life have increased dramatically during first-quarter 2022.
Ongoing supply growth and enduring advantageous pricing for ethane will continue to be critical factors for USGC ethylene producers. If ethylene production costs based on purity ethane are consistently lower than costs based on light paraffinic naphtha, USGC ethylene producers will maintain economic advantages relative to producers in Europe and the Asia Pacific who still rely on naphtha feedstocks.
Based on continued growth in crude oil and associated gas production in New Mexico and Texas, propane+ supply will increase, as will ethane recovery as new plants come onstream. Raw-mix pipeline capacity, however, may emerge as a constraint to ethane supply within the next few years. If raw-mix pipeline grid capacity does not constrain ethane recovery, gas processors will increase ethane recovery as needed whenever spot prices reach levels that yield positive recovery margins.
The author
Daniel L. Lippe ([email protected]) is president of Petral Consulting Co., which he founded in 1988. He has expertise in economic analysis of a broad spectrum of petroleum products including crude oil and refined products, natural gas, natural gas liquids, other ethylene feedstocks, and primary petrochemicals.
Lippe began his professional career in 1974 with Diamond Shamrock Chemical Co., moved into professional consulting in 1979, and has served petroleum, midstream, and petrochemical industry clients since. He holds a BS (1974) in chemical engineering from Texas A&M University and an MBA (1981) from Houston Baptist University. He is an active member of the Gas Processors Suppliers Association.
