US olefins producers monitor factors affecting export recovery
Dan Lippe
Petral Consulting Co.
Houston
After juggling second and third waves of the coronavirus (COVID-19) global pandemic alongside the most active Atlantic hurricane season on record in second-half 2020, US Gulf Coast (USGC) ethylene producers in first-half 2021 managed a swift recovery from an unprecedented winter deep freeze that caused severe production losses from Texas Gulf Coast plants.
Finding themselves spared of severe tropical storm activity during the early months of the June-November 2021 hurricane season, USGC operators remained on guard by midsummer 2021. Producers also were evaluating how an alarming resurgence in global COVID-19 infections could affect industry expectations for a sharp rebound in polymer exports through 2023.
In addition to evaluating impacts of weather-related downtime in second-half 2020 and early 2021 on olefins-polyolefins supply and pricing during first-half 2021, this article examines prospects for recovery to full supply and normal pricing in second-half 2021.
Pandemic, weather woes
Even with the appearance of a second major COVID-19 variant in the UK during first-quarter 2021, impacts of the pandemic on refining and chemical producers seemed reasonably predictable heading into midyear: transportation-sector demand for refined products and refinery operating rates would remain sluggish but begin gradual recovery as vaccine rollouts returned immunized populations to prepandemic routines.
While increasing international demand for primary olefins and polymers exports largely shielded USGC producers from COVID-19-related effects resulting from restrictions on travel, social gatherings, and retail activity, chemical and refining companies along the Texas Gulf Coast were not immune to the region’s coldest winter weather in 33 years and its unexpected disruption of the state’s electric power grid. Despite 6 weeks of downtime following the mid-February 2021 freeze, ethylene producers had returned 95% of operating capacity in Texas to service by early April. More importantly, the 6 weeks provided definitive evidence of the USGC petrochemical industry’s importance to global markets.
Ongoing rollouts of COVID-19 vaccinations globally during first-half 2021 offered initial hope of a return to prepandemic behaviors—and an accompanying increase in demand for petroleum-derived products—until worldwide health data began to show cracks in the vaccination plan. Based on global statistics aggregated by Worldometer, daily new COVID-19 global cases peaked at 842,000 on Jan. 7, 2021, declining within 6 weeks to 287,000 on Feb. 22, 2021. As governments around the world began relaxing lockdown restrictions, however, daily cases surged to about 900,000 in late April. While daily infection rates fell sharply again following the start of US vaccine rollouts, the low lasted only a few weeks. As of late July, daily new cases globally exceeded 500,000 and—as vaccine-resistant variants delta, lambda, and beta continue to spread—likely will reach 800,000-900,000 before end-September 2021.
Depending on how governments in North America, Europe, India, and major economies in the Asia Pacific northeast respond to the virus’s fourth and fifth waves, demand for transportation fuels is less likely to recover to prepandemic volumes until first-half 2022. Because refinery-sourced naphtha is the primary feedstock for ethylene plants outside North America, continued restrictions on crude runs have the same relative impact on global naphtha supply. To some extent, geographic variations in the current wave of COVID-19 infections will impact refinery operating rates and availability of refinery-sourced feedstocks.
Even though the global pandemic so far has had limited impact on demand for ethylene coproducts, naphtha supply constraints will continue limiting production of ethylene and primary ethylene derivatives unless most major governments emphasize economic recovery instead of minimizing their populations’ exposure to COVID-19 and its variants.
Regardless of these concerns, North American ethylene producers will have feedstock supply and production costs advantages enabling them to run plants at full capacity, subject only to potential impacts of the USGC 2021 hurricane season.
Ethylene production
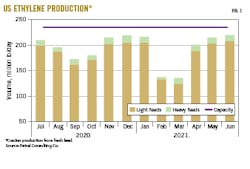
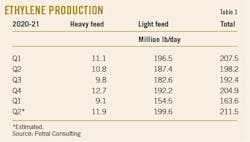
Petral Consulting Co. tracks US ethylene production via a monthly survey of operating rates and feed slates. In first-half 2021, US operators produced 33.6 billion lb of ethylene, with operating rates varying from a high of 94% in January to a low of 59% in March (Table 1). First-half 2021 operating rates averaged 80.5% when including February-March and 90% when excluding those 2 months of storm-impacted operations.
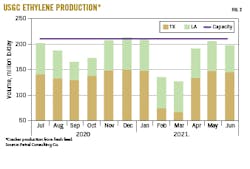
First-half 2021 ethylene production from USGC plants averaged 32.3 billion lb, down 3.4 billion lb (9.5%) from first-half 2020. As a result of the weather-related outages in February-March, Texas plants during first-half 2021 produced 21.8 billion lb, 3.44 billion lb (13.8%) less than the same 6 months in 2020. First-half 2021 production from Louisiana ethylene plants—which experienced no weather-related downtime—totaled 10.5 billion lb, up 54.2 million lb (0.5%) from the same period in 2020.
Texas production losses were avoidable. Freezing temperatures resulting from the mid-February Arctic cold front—while inconvenient and uncomfortable—were not the primary reason for the 5-billion lb production loss from Texas plants. For various reasons related to availability of generation capacity, the Electric Reliability Council of Texas (ERCOT)—the power grid system operator for most of Texas—imposed rolling blackouts on all but its highest-priority customers. Despite gas processing plants’ designation as critical infrastructure and inclusion in the highest-priority category, ERCOT cut power supply to many of these plants, forcing them to shut down, which in turn forced oil and gas producers to halt production.
US Energy Information Administration (EIA) statistics showed total natural gas production for February 2021 was down 3.96 bcfd from January but about 8 bcfd (32%) lower during second-half February (following the rolling blackouts) compared with second-half January. The dramatic drop in gas production forced pipeline companies—especially intrastate pipeline operators—to allocate supply to their highest priority customers. Since gas-fired power plants and industrial complexes such as refineries are classified as low-priority customers, many gas-fired power plants shut down as pipeline operators imposed these allocation rules, further limiting feedstock supply to ethylene plants.
The Texas coast is home to 21 ethylene plants at 16 locations with a combined production capacity of 53.4 billion lb/year (146.3 million lb/day). Of these:
- 16 plants with total capacity of 35.1 billion lb/year (96.2 million lb/day) are in the Houston Ship Channel area.
- Five plants with total capacity of 10 billion lb/year (27.4 million lb/day) are in the Beaumont-Port Arthur, Tex., area.
- Four plants with total capacity of 8.2 billion lb/year (22.6 million lb/day) are between Matagorda Bay and Corpus Christi, Tex.
While the five plants in the Beaumont-Port Arthur area are outside the ERCOT power grid, four depend on feedstock arriving from Mont Belvieu, Tex., which is within the ERCOT grid.
Between July 2020-January 2021, ethylene production from Texas plants totaled 141.6 million lb/day before falling to 74.7 million lb/day in February and 67.7 million lb/day in March. Capacity utilization at Texas plants was 47% in February and 43% in March. With post-freeze repairs for some plants extending beyond the average 6-week period, Texas ethylene production for April 2021 totaled 135 million lb/day with plant capacity utilization at 85%.
During first-quarter 2021, ethylene production from Louisiana plants was 60 million lb/day before slipping to 56 million lb/day in the second quarter, with plant operating rates of 94% and 87%, respectively.
Fig. 1 shows trends in total US ethylene production. Fig. 2 shows production from Texas and Louisiana ethylene plants.
Global turmoil, products pricing
In the 6 months leading up to yearend 2020, spot prices for West Texas Intermediate (WTI) crude at Cushing lingered in a range of $35-40/bbl, with pricing for international benchmarks Brent and Organization of Petroleum Exporting Countries (OPEC) Reference Basket (ORB) crudes between $40-45/bbl.
After the US Food and Drug Administration (FDA) issued emergency use authorizations (EUA) for the Pfizer-BioNTECH and Moderna COVID-19 vaccines in mid-December 2020, however, a change in the forward view of crude oil demand sparked a strong price rally. Beginning in February 2021, global media reported almost daily on the millions of vaccinations that were administered, prompting perceptions within the crude oil trading community that global demand for transportation fuels was recovering quickly. The rally was further supported by FDA’s approval of Johnson & Johnson’s EUA for its vaccine, which began shipping in early March. After 9 months of bearish news, forward views became bullish almost overnight.
As production and delivery of all three COVID-19 vaccines began, local and state governments in March-April 2021 started lifting quarantine and emergency restrictions on churches, bars, and restaurants. By mid-July, 340 million doses of COVID-19 vaccines had been administered, and US pharmaceutical companies were shipping tens of millions of vaccine doses to other countries.
Alongside recognizing in second-half 2020 that demand for gasoline and diesel fuel would begin a sustained rebound in first or second-quarter 2021 as vaccination rollouts encouraged governments to end lockdown restrictions, OPEC also recognized its future supply management strategy needed to be consistent with the uncertainties of demand recovery. While its 2020 production curtailment agreement—which emphasizes a monthly review of the global crude supply-demand balance and limits member countries’ monthly production fluctuations to a maximum of 400,000 b/d—was scheduled to expire in July 2021, OPEC subsequently agreed to extend the timeframe for phasing out the strategy to September 2022.
In June 2020, production from OPEC member countries—which began rationing output in May-June 2020—totaled 19.84 million b/d, down from 25.14 million b/d in first-quarter 2020. By December 2020, however, OPEC production was 21.71 million b/d, up 1.86 million b/d from June. Saudi Arabia increased production 1.48 million b/d in second-half 2020, accounting for 79.5% of OPEC’s production creep.
Although unexpected changes in geopolitical relationships within the Middle East—including Iran’s 25-year economic development agreement with China—continued to influence traders’ perceptions of crude supply trends in first-half 2021, the mid-February weather event in Texas had a larger impact on coproduct prices and ethylene production costs at the USGC. As ethylene production and refinery operating rates crashed, coproduct supply also collapsed, sending USGC spot prices for major coproducts (propylene, butadiene, aromatics) to record-high levels and persistently higher than prices in the Asia Pacific and Europe.
Between December 2020-July 2021, prices for WTI, Brent, and ORB grades increased 76%, 75%, and 71%, respectively, pushing prices higher for crude-derived feedstocks such as naphtha. Since naphtha accounts for 50%-100% of feed for many ethylene plants in Europe and the Asia Pacific, ethylene production costs increased much more for international operators than USGC producers. In August-November 2020, naphtha prices in Rotterdam, Singapore, Japan, and the Arabian Gulf increased to 19-20¢/lb in December and 28-30¢/lb in June-July 2021 from a first-half 2020 baseline of 16-17¢/lb.
Prices for Mont Belvieu natural gasoline and USGC naphtha tracked rising naphtha prices in primary international markets. Based on pricing trends for naphtha feedstocks at all major pricing points, feedstock costs for ethylene producers everywhere except the USGC increased by 11-12¢/lb (68-74%).
Spot prices for ethane in Mont Belvieu were 7.2¢/lb in August-November 2020 and 9.7¢/lb in June-July 2021.
Ethylene production costs
Ethylene production costs are determined by raw material costs and coproduct credits. Based on variations in yield patterns for the various feeds, coproduct volumes range widely between the three categories of plants (ethane-only, LPG-only, and multifeed plants). Of these three categories, only producers with multifeed plants actively manage the mix of feeds in response to changes in variable production costs for ethane, propane, and heavy feeds.
Raw material costs are determined by each feedstock’s price and its conversion to ethylene. Similarly, coproduct credits are determined by spot prices and production volumes for each coproduct but only for those plants that upgrade all coproduct streams to meet purity specifications.
A few ethylene plants can upgrade all coproducts to purity streams and sell all coproducts at market prices. Most ethylene plants produce purity coproduct propylene but produce all other coproducts as mixtures (mixed butylene-butadiene and mixed aromatics) and sell mixtures at discounted prices. Variations in realized revenue for coproducts result in large differences in coproduct credits from one plant to another. Cash production costs are determined by simple addition of raw material costs and coproduct credits (see accompanying box).
Crude oil prices greatly influence prices (directly or indirectly via the value of one feedstock as a substitute for another) for most feedstocks and coproducts and are especially important as the primary driver for naphtha, propane, normal butane, propylene, and aromatics.
In second-half 2020, prices for major crude benchmarks Brent, ORB, and WTI were unusually stable, varying within a narrow range of $40-45/bbl in July-November. Between December 2020-March 2021, the rollout of COVID-19 vaccines alongside OPEC’s decision to adjust production limits monthly boosted crude prices by $21-22/bbl and an additional $10-12/bbl in May-July 2021.
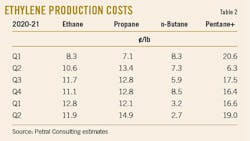
While the bullish trend in crude and naphtha prices directly influenced ethylene production costs in Europe and the Asia Pacific, producers of ethylene at the USGC—80% of which is based on ethane—continued to benefit from a persistent surplus of the feedstock. The weighted-average production cost for ethylene at Texas and Louisiana plants was 11-12¢/lb in second-half 2020 and 12-13¢/lb in first-half 2021 (Table 2). While ethane-based production costs were 11.3¢/lb in January 2021 through early February, prices jumped to 16.5¢/lb later in the month amid a spike in natural gas prices following the mid-month weather event. Between March-June 2021, however, ethane-based production costs returned to 11-12¢/lb.
In first-half 2021, weighted-average production costs for ethylene based on LPG and heavy feeds (excluding February) varied within a range of 11-24¢/lb.
Stability and production cost advantages are important to USGC ethylene producers’ objective of operating all new capacity (monomer plants, downstream polymer units) at full rates. The USGC’s ethane-based production cost advantage is the critical parameter for any recovery in the polyethylene export market, as well as for the region’s ability to absorb growing production of polyethylene and other derivatives during the next 5 years.
Petral Consulting routinely estimates ethane rejection volumes. In second-half 2020, total US ethane supply was 2.0-2.1 million b/d, with ethane rejection for low-cost basins (Kansas-Oklahoma, New Mexico, Texas) 280,000-360,000 b/d during the period. Production plus ethane rejection from low-cost basins give US ethylene producers the ability to increase production by a minimum of 3-5 billion lb/year.
Ethane rejection in the Marcellus-Utica shale region will be an important consideration for the economic viability of Shell Chemical Appalachia LLC’s Shell Polymers Monaca site—including a dual 1.5-million tonne/year (tpy) ethylene and 1.6-million tpy polyethylene complex under construction just southwest of Monaca, Pa.—which will require 85,000-95,000 b/d of ethane feedstock. During first-half 2021, ethane rejection in the Marcellus-Utica basin was 140,000-150,000 b/d.
When ethane is rejected, it is gone forever. When excess ethane is produced, it accumulates in storage and serves the important purpose of extending stable ethane prices. Based on 250,000 b/d of ethane rejection through yearend 2021, USGC ethylene producers have sufficient ethane availability to accommodate anticipated 2021 demand, as well as enough supply to meet demand should two of the three new US plants under construction reach startup in 2022-23.
Ethylene pricing, profit margins
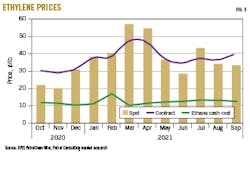
Before ethylene production crashed in February 2021, spot ethylene prices varied within a range of 15-22¢/lb. In December 2020, spot prices at Nova Chemical Corp.’s hub in Mont Belvieu had increased to 30-32¢/lb before rising to 38-42¢/lb in January-February and 54-58¢/lb in March-April. After Texas ethylene producers increased production following the February freeze to 145-150 million lb/day in May-June, spot prices at Nova Chemical’s hub fell to 26¢/lb before recovering later in June to 28-30¢/lb.
In mid-June 2021, one Louisiana ethylene plant experienced operating problems, with two other units experiencing unplanned downtime in July due to a minor fire. Production losses sparked a surge in spot prices at all pricing locations. According to OPIS PetroChem Wire, spot prices at Nova Chemical’s hub reached 50-55¢/lb in July but slipped below 50¢/lb before the month’s end. At Choctaw Dome, La., spot prices rose to 59¢/lb and remained above 55¢/lb into late July.
Net transaction prices (NTP) result from extensive negotiations between a group of producers and buyers and are frequently settled retroactively. From this perspective, NTP prices are more important than spot prices. In March-April 2021, NTP prices jumped to 47.0-47.25¢/lb from 37-38¢/lb in January-February. As Texas producers restored plants to full capacity, negotiations reduced NTP for May to 37.75¢/lb and 34.3¢/lb for June. Spot prices are again likely to revert to the usual cost-plus basis when recent Louisiana production problems are resolved.
In first-half 2021, profit margins based on spot prices at Nova Chemical’s hub and full cash costs averaged 31.1¢/lb for ethane and 26.8¢/lb for propane. When ethylene spot prices peaked in March-April 2021, profit margins were 43-47¢/lb for ethane and 35-37¢/lb for propane. Margins for light naphtha were 31-34¢/lb in February-April. As coproduct prices declined, light naphtha margins fell to 8¢/lb in early June before rebounding later that month alongside the jump in ethylene spot prices.
Fig. 3 shows historical trends in ethylene spot prices and NTPs.
Given notable production losses caused by weather events in second-half 2020 and first-half 2021, an overview of forecasts for the 2021 hurricane season is important to the outlook for second-half 2021 and first-half 2022. August and September are the peak months for hurricane activity in the Atlantic basin. In years when Gulf of Mexico hurricane activity was below average, wind shear and African dust were deemed responsible. In years of peak tropical storm activity, wind shear is minimal, dust clouds from West Africa do not disrupt storm formation, and water temperatures in the Caribbean and Gulf of Mexico are above average. Weather along the Texas and Louisiana coasts and the northern Gulf of Mexico for most of July 2021 was persistently rainy, keeping sea-surface temperatures below average. Weather in Texas coastal areas, however, shifted in late July to temperatures of 95° F.+ with little to no rain, leaving conditions in the Gulf of Mexico increasingly favorable for storm formation as sea-surface temperatures increased to 88-90° F.
According to the National Oceanic and Atmospheric Administration (NOAA), the Atlantic basin in 2021 will experience 13-20 named storms, including 6-10 hurricanes, 3-5 of which are to become major storms of Category 3 or higher. As of mid-August, the Atlantic basin had experienced eight named storms, three of which reached hurricane status before making landfall. Forecasts from other sources also are calling for total named storms and hurricanes at the upper end of NOAA’s forecast ranges.
Olefin-plant feed slate trends
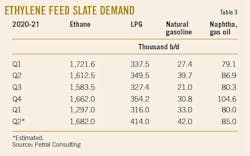
Petral Consulting’s monthly survey of plant operating rates and feed slates showed industry demand for light feedstocks (ethane, propane, and normal butane) was 1.85-1.88 million b/d in first-quarter 2021 but increased to 2.0-2.2 million b/d in the second quarter. If we exclude depressed feedstock demand volumes during February-March from the count, light feed demand would have averaged 2.10-2.15 million b/d during first-half 2021.
Total US light feed demand in February-March was 1.40-1.45 million b/d. At the USGC, light feed demand from Texas plants fell from 1.45-1.50 million b/d in January to 0.67-0.75 million b/d in February-March, while light feed demand from Louisiana plants during first-half 2021 remained steady in both quarters at 0.55-0.60 million b/d.
Table 3 shows trends in ethylene feedstock demand.
Ethylene, polyethylene exports
Based on monomer (ethylene, propylene) and polymer (polyethylene, polypropylene) exports, Petral Consulting concludes that ethylene and polyethylene are now fully integrated components of their respective global markets, while propylene and polypropylene remain components of their respective domestic markets. Trends in polymers exports particularly support these conclusions.
If USGC ethylene producers maintain their cost advantage for ethylene monomer production and continue using their extensive feedstock flexibility to their advantage, regional producers can remain confident US polyethylene exports to international markets will continue to grow. Polymer exports are, after all, much more important to USGC ethylene producers than monomer exports.
Enterprise Products Partners LP and Navigator Holdings Ltd. commissioned thier 50-50 joint venture marine export terminal at Morgan’s Point, Tex., along the Houston Ship Channel, in January 2020. During the 24 months before the terminal’s startup, US ethylene exports averaged 1.15 million lb/day before increasing to 3.78 million b/d in the 18 months following commissioning of Morgan’s Point.
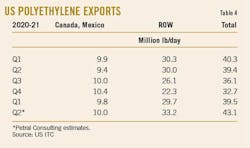
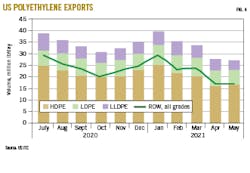
A similar comparison of polyethylene exports shows exports to all destinations (ROW) other than Canada and Mexico were 21.2 million lb/day in 2018-19 and increased to 30.2 million lb/day in first-half 2020. Among its many undesirable effects, COVID-19 disrupted international supply trains, causing backlogs of empty container vessels in many US ports.
Despite these problems, polyethylene exports to ROW destinations—after falling to 21.1 million lb/day in fourth-quarter 2020—rebounded to 25.3 million lb/day in first-quarter 2021 (Table 4). In January, ROW exports reached 28.9 million lb/day, with total exports hitting nearly 40 million lb/day. As Texas ethylene and polyethylene production crashed following the winter freeze, polyethylene exports to ROW destinations fell to 23.6 million lb/day in February, 23.3 million lb/day in March, and 17 million lb/day in April-May, plummeting more sharply in April-May than in the aftermath of hurricanes that struck the Lake Charles, La., area during August-October 2020.
While Texas ethylene derivatives plants from Houston to Corpus Christi suffered extensive downtime due to power blackouts and lack of monomer supply after the February freeze, the interruptions did not reduce domestic demand for polyethylene resins. Instead, chemical companies liquidated polyethylene inventories. Since polyethylene inventory had not fully recovered from hurricane-related downtime in fourth-quarter 2020, however, declining polyethylene inventory in early 2021 resulted in surging prices for high-density polyethylene (HDPE).
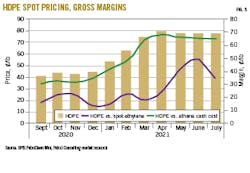
Spot prices for HDPE exports in September-December 2020 were 43.2¢/lb, up 7.5¢/lb (21%) from June-July 2020, according to OPIS PetroChem Wire. Although ethylene production recovered to 215-220 million lb/day between November 2020 and first-half February 2021, HDPE export prices continued to strengthen, rising 12¢/lb in January-February, 6¢/lb during March, and only 2¢/lb in April before holding constant at 78¢/lb in May-July 2021 vs. 35-40¢/lb in first-half 2019.
US chemical companies produce ethylene to meet sales of their various ethylene derivatives, exporting polyethylene and other derivatives to meet needs of international markets. Until polyethylene resin inventory recovers and new capacity comes on stream, polyethylene supply will remain very tight and prices well above historic norms relative to ethylene production costs.
Fig. 4 shows US exports for the three primary grades of polyethylene. Fig. 5 shows pricing and margin trends for HDPE.
Propylene supply
Coproduct propylene supply depends primarily on the use of propane, normal butane, naphtha, and other heavy feeds. In first-half 2021, monthly survey results showed USGC plant demand for LPG feeds (propane, normal butane) was 371,000 b/d, with demand for heavy feeds at 112,500 b/d. Combined demand for LPG and heavy feeds accounted for 26.6% of fresh feeds to all Texas plants and 23.7% for Louisiana plants.
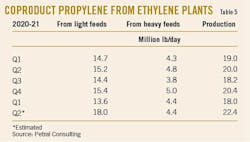
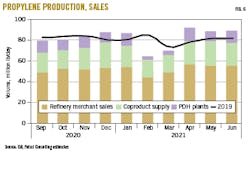
Total coproduct propylene supply from all USGC plants was 19.8 million lb/day in first-half 2021. Coproduct supply from plants outside the USGC increased total supply during the period to 20.2 million lb/day. If widespread power outages had not caused 45 days of downtime for all Texas Gulf Coast ethylene plants from mid-February through early April, coproduct propylene supply in first-half 2021 would have been 21.5-21.7 million lb/day.
Table 5 shows Petral Consulting’s estimates of coproduct propylene supply.
Refinery propylene sales into the merchant market are a function of:
- FCCU feed rates (most important variable).
- FCCU operating severity (important but not directly measurable).
- Economic incentive to sell propylene rather use it as feed to alkylation units.
Seasonal variations in refinery operating rates directly influence FCCU feed rates, and the combination of feed rates and operating severity are the most important factors determining variations in refinery-grade propylene supply. USGC and Midcontinent refineries account for 95% (or more) of refinery propylene supply for USGC propylene consumers.
In first-half 2021, US gasoline demand continued the slow recovery that began in third-quarter 2020. Total gasoline demand (domestic consumption plus exports) in January 2021 was 8.9 million b/d, down 765,000 b/d (8.7%) from January 2020. As USGC refineries returned to full operating rates in April, exports increased by 100,000 b/d, while domestic demand was up almost 2 million b/d from January. Improved demand supported rising crude runs and feed rates for FCC units and cokers at USGC and Midcontinent refineries.
In second-half 2020, FCCU feed rates were down 250,000-550,000 b/d (11-13%) from the same period in 2019. In April 2021, however, FCCU feed rates increased to 147,000 b/d (4.3%) above feed rates during the last 6 months of 2019. While FCCU feed rates are the primary driver for refinery-grade propylene supply, operating severity is also important. EIA does not track operating severity, but Petral Consulting is able to track the ratio of refinery propylene supply vs. FCCU feed rates using historic average ratios (lbs/day of propylene supply vs. b/d of FCCU feed).
Using average ratios for 2018-19, we observed refinery-grade propylene supply ratios in second-half 2020 were 8-17.5% higher than average for USGC refineries and 2.4-8.4% higher for Midcontinent refineries. In first-quarter 2021, ratios were 20% higher for USGC refineries and 15.7% higher for Midcontinent refineries. Higher ratios in 2020-21 confirm the preliminary conclusion that most refiners ran FCCUs at higher operating severity than in 2018-19.
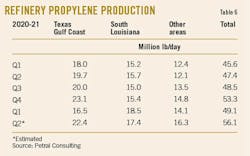
Table 6 shows trends in geographic distribution of refinery propylene supply.
Petral Consulting routinely estimates FCCU feed rates based on EIA weekly statistics for refinery crude runs to determine reasonable estimates for refinery propylene sales. Merchant sales of propylene from USGC and Midcontinent refineries were 45.4 million lb/day in January 2021 and 46.5 million lb/day in April. Sales in May-July increased to 50-51 million lb/day. In May-July 2018, merchant sales volumes were lower at 36-38 million lb/day and 48-49.5 million lb/day during May-July 2019.
While merchant propylene sales are also a function of pricing relative to unleaded regular gasoline, this factor is secondary to the importance of FCCU feed rates and operating severity because many of the largest refineries in Louisiana and Texas are integrated with onsite olefins plants. These olefins plants have spare capacity in their propylene towers to enable upgrading of refinery-grade propylene directly at the variable operating cost of these propylene towers (less than 1.0-1.5¢/lb).
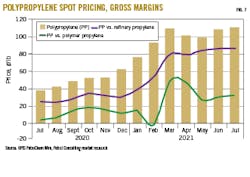
In second-half 2020, polymer-grade propylene held premiums of 18-20¢/lb over refinery-grade propylene before surging to premiums of 35-55¢ in first-half 2021.
While refinery propylene pricing remained at a premium of 2.5¢/lb to unleaded regular gasoline prices in September-December 2020, prices weakened to discounts of 9-18¢/lb in second-quarter 2021. Variations in refinery-grade propylene pricing relative to unleaded regular gasoline had no measurable impact on refinery propylene supply, further supporting the observation that producers upgrade a large volume to polymer-grade propylene via internal propylene purification towers in associated olefins plants.
Fig. 6 shows coproduct supply trends, propane dehydrogenation (PDH) plant production, and refinery merchant sales of propylene.
Propylene economics, pricing
As crude oil prices for all major benchmarks increased in first-half 2021, unleaded regular gasoline prices in the USGC pipeline market kept pace, with premiums to ORB crude at 30¢/gal in the first quarter and 44¢/gal during the second quarter. In first-quarter 2021 spot prices varied within a range of 150-195¢/gal (24-32¢/lb). In the following quarter, unleaded regular gasoline’s rising premium to crude benchmark pricing alongside strengthening crude cash prices ushered unleaded regular gasoline prices to 195-215¢/gallon (32-35¢/lb). Using unleaded regular gasoline prices as the independent value basis, refinery-grade propylene prices were 37-40¢/lb in January-February before falling to 30¢/lb in March, according to OPIS PetroChem Wire. In January-February, refinery propylene prices were at premiums of 11-13¢/lb to unleaded regular gasoline but slipped to modest discounts of 1-2¢/lb in March.
As Texas refining capacity returned following the February freeze, refinery-grade propylene sales from Texas refineries were 23.2 million lb/day, equal to record-high volumes of November-December 2020. As total supply from USGC refineries increased, spot prices for refinery propylene in May fell to 15.2¢/lb, or discounts of 18¢/lb to unleaded regular gasoline.
If refinery-grade propylene was a truly independent chemical commodity, deep price discounts would discourage many refineries from maintaining refinery propylene sales at record-high volumes. But the largest Texas and Louisiana refineries are operated by companies with integrated ethylene plants nearby. As ethylene plants in these integrated systems have reduced their use of LPG and heavy feeds, the olefins units have been left with spare capacity in their propylene towers for several years.
While the variable cost to upgrade refinery-grade propylene to polymer-grade quality is no more than 2-3¢/lb, differential pricing between the two grades—which hovered at 15-18¢/lb in 2018-20—jumped to a range of 40-50¢/lb in February-March 2021 and 50-55¢/lb in May-July. If polymer-grade propylene prices remain at extreme premiums to refinery-grade propylene, those refineries that are capable of upgrading supply to polymer-grade quality will maintain refinery-grade propylene sales at record-high volumes, leaving prices at deep discounts to unleaded regular gasoline.
Two economic factors are the primary drivers for polymer-grade propylene prices. The cost of upgrading refinery propylene via propane-propylene fractionation units (commonly known as PP splitters) is a well-established driver. A few companies control merchant fractionation capacity for upgrading refinery propylene to polymer-grade quality. Based on 36 months of historical prices and pricing differentials, the usual pricing uplift to upgrade refinery propylene to polymer-grade propylene is 12-15¢/lb. Polymer-grade propylene premiums to refinery-grade propylene were 15-16¢/lb in first-half 2020 before increasing to 18-19¢/lb (+17.5%) in second-half 2020.
Stronger polymer-grade propylene premiums to refinery propylene also found support in first-half 2021 from speculative trading based on scheduled maintenance turnarounds for two of the three USGC PDH plants, as well as the loss of 300-400 million lb of refinery-grade propylene supply in February-March 2021.
The conversion cost of propane to propylene via a dehydrogenation unit is another important price driver for polymer-grade propylene. Propane is a PDH plant’s major cost, and PDH plant process economics vary directly with propane prices. With polymer-grade propylene markets generally well-supplied in 2019-2020, polymer propylene premiums to propane were 15-25¢/lb in 2019 and 12-15¢/lb during first through third-quarters 2020. While premiums to propane spiked to 60-65¢/lb in February 2021, they weakened in March-June to a wide range of 30-45¢/lb. Based on historic average ranges for propylene premiums to propane, Petral Consulting views polymer-grade propylene prices to be overvalued by 30¢/lb. If supply recovery was the primary consideration for price trends in second-half 2021, spot prices would probably fall to 40-45¢/lb. The mid-February freeze, however, also disrupted production of propylene derivatives. While second-half 2020 spot prices for polypropylene remained within a range of 50-65¢/lb, early 2021 supply disruptions supported a price spike to 100-110¢/lb in March through June-July 2021.
Reports are now circulating that polypropylene fabrication companies are shutting down production lines due to zero or negative profit margins. As polypropylene sales into the domestic market decline, polypropylene availability will improve, and polypropylene prices will fall sharply and abruptly, increasing downward pressure on polymer-grade propylene prices.
Fig. 7 shows trends in polypropylene differential pricing vs. spot pricing for refinery and polymer-grade propylene.
Propylene, polypropylene exports
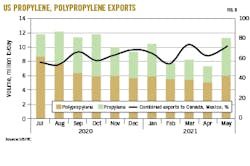
Historically, almost all US propylene monomer exports are delivered to Mexico and Colombia, and developments in first-half 2021 did not materially impact exports to either destination. Total exports were 3.1 million lb/day in first-quarter 2021, fell to 2.2 million lb/day in April, but recovered to 5.2 million lb/day in May for a 2-month average of 3.7 million lb/day. This left early 2021 propylene exports lower from exports of 4.1 million lb/day in third-quarter 2020 and 4.8 million lb/day in fourth-quarter 2020.
Combined exports to Mexico and Colombia were 3.05 million lb/day in first-quarter 2021 and 3.70 million b/day in April-May 2021, with exports to the two countries accounting for 99% of total exports during the first and second quarters.
In 2014-15, US polypropylene exports were 5.9 million lb/day before jumping to 9.0-9.3 million lb/day in third-quarter 2016 through first-quarter 2017. Following first-quarter 2017, polypropylene exports settled into relatively stable volumes of 5-6 million lb/day through 2019 but recovered to average 6.9 million lb/day during 2020. Exports once again have slipped into the established normal range of 5-6 million lb/day. Canada and Mexico remain primary destinations for US polypropylene exports, usually accounting for 65-80% of total exports.
Polypropylene exports in the range of 5-7 million lb/day over a 5-year period are consistent with stable demand in the domestic market. As US propylene supply from new PDH plants increased by 5-7 million lb/day, US propylene balances shifted from 1 million lb/day of net imports to net exports of 3.4 million lb/day in 2020. Rising propylene exports offset 70-75% of increasing supply from PDH plants.
Fig. 8 shows trends in propylene and polypropylene exports.
2021-22 outlook
As new capacity for major ethylene derivatives comes onstream in 2022-23, US ethylene producers must maintain production from existing capacity and ramp up production from new plants to keep pace with monomer-supply requirements of new derivatives units that will come onstream before new olefins units reach their full production rates.
After local and state governments in Texas and Pennsylvania imposed lockdown mandates in 2020 to curb the spread of COVID-19, chemical companies suspended construction of all new plants slated to come on stream in 2022-23. While construction activities have now fully resumed, given their size and scope, these plants may have more than the usual number of problems to resolve before achieving normal, reliable operation, as evidenced by the most recently commissioned Louisiana plants, some of which did not reach full capacity until 6-9 months following their official startup dates. As new derivatives units come on stream in advance of olefins units, USGC ethylene supply will remain tight and allocated to the most profitable derivatives. With polyethylene the largest global derivatives market, ethylene supply constraints may limit production of other derivatives such as ethylene glycol.
In late July 2021, Saudi Arabian Basic Industries Corp. (SABIC) and ExxonMobil Corp. completed construction of major derivatives units at their 50-50 joint venture Gulf Coast Growth Ventures LLC’s (GCGV) 1.8-million tpy ethane cracker in Portland, San Patricio County, Tex., near Corpus Christi (OGJ Online, July 26, 2021). Mechanical completion of the complex’s polyethylene and ethylene glycol units marked the beginning of the USGC ethylene market’s next wave of new capacity 6 months or more ahead of any of the three new plants now under construction reaching full ethylene production rates (OGJ, Aug. 2, 2021, p. 35).
Based on detailed results of Petral Consulting’s monthly survey of ethylene production, half of previously commissioned new USGC units now in service ran as high as 115% of nameplate capacity after reaching stable operations. Producers will be able to use the additional supply to run older units at lower rates or to offset supply losses during periods of unplanned downtime.
Continued growth in ethane supply and stable ethane pricing are also critical factors for USGC ethylene producers. If ethylene production costs based on purity ethane feedstock remain consistently lower than costs based on light paraffinic naphtha, USGC producers will maintain economic advantages relative to naphtha-based ethylene producers in Europe and the Asia Pacific.
For 2021-22, GCGV’s project and Bayport Polymers LLC’s (Baystar) integrated 1-million tpy ethane steam cracker and 625,000-tpy HDPE plant in Port Arthur and Pasadena, Tex., respectively, will increase ethane demand by 140,000-180,000 b/d. Midstream companies with gas plants in these areas have sufficient ethane-recovery capability to meet the increased demand without running at full-ethane recovery rates. As the ethane supply cushion shrinks, however, upward pressure on ethane pricing will increase. If naphtha prices remain based on crude prices in a $55-75/bbl range, though, USGC ethylene producers will maintain their cost advantage over producers in Europe and the Asia Pacific, which operate naphtha plants with limited or no feedstock flexibility.
USGC producers operate 15 units equipped with major flexibility to adjust their mix of feeds. These units—with nameplate capacity of 42 billion lb/year—increased their use of heavy feeds from 8-10% of fresh feed to 14-16% of fresh feed on three different occasions in 2020 through first-half 2021. On two of these occasions, producers with feedstock flexibility responded to unexpected shifts in production costs when LPG and heavy feeds were less expensive than ethane. In the last 3 years before ethane availability routinely exceeded demand (2005-07), plants with feedstock flexibility frequently ran 35-40% heavy feeds.
Feedstock flexibility will also contribute to the USGC industry’s favorable cost basis, allowing regional producers to take advantage of short-term supply and price disruptions in propylene and aromatics markets.
During the next 5 years, however, OPEC will face circumstances similar to those experienced in 2020-21 that could weaken crude prices to levels that result in LPG and heavy feeds becoming less expensive than ethane for two or three quarters.
The author
Daniel L. Lippe ([email protected]) is president of Petral Consulting Co., which he founded in 1988. He has expertise in economic analysis of a broad spectrum of petroleum products including crude oil and refined products, natural gas, natural gas liquids, other ethylene feedstocks, and primary petrochemicals.
Lippe began his professional career in 1974 with Diamond Shamrock Chemical Co., moved into professional consulting in 1979, and has served petroleum, midstream, and petrochemical industry clients since. He holds a BS (1974) in chemical engineering from Texas A&M University and an MBA (1981) from Houston Baptist University. He is an active member of the Gas Processors Suppliers Association.
