Recovery poses uncertainties for US midstream operators
Dan Lippe
Petral Consulting Co.
Houston
Whenever one asks if a situation can worsen, it usually does, and second-half 2020 through first-quarter 2021 confirmed this pragmatic perspective for US Gulf Coast (USGC) olefins producers and refiners. Collapsing demand for petroleum products kicked in with a vengeance in March-April 2020 as governments around the world imposed nearly universal bans on cruise and international air travel, social gatherings, and retail economic activity to curb the spread of coronavirus (COVID-19). Nearly 15 months later, many of these first-response measures remained in place to some degree, keeping demand for transportation fuels below prepandemic levels.
While reduced demand for gasoline, jet fuel, and diesel fuel weighed heavily on crude oil producers and refiners, the COVID-19 pandemic supported US midstream producers by increasing international demand for LPG exports from USGC export terminals. Ironically, for US midstream operators, bad news globally was good news locally.
As global demand for transportation fuels gradually recovers in the wake of the worst of the COVID-19 health crisis, however, crude oil producers in the Middle East and Russia will increase output to meet rising refinery crude runs—primarily in the Asia Pacific and Europe—and rising associated gas production will restore gas plant NGL supply to prepandemic levels.
Demand disparities
Following its initial collapse in March-May 2020 amid a halt in everyday commuter travel due to quarantine restrictions, US gasoline demand in second-half 2020 was down 9.4% from second-half 2019. Consistent with increased online shopping following the viral outbreak, demand for home delivery services spiked to offset some of the decline in US distillate fuel oil demand, which was only 7% lower in second-half 2020 from the previous year. Ongoing limitations on business and personal air travel during second-half 2020 left jet fuel demand 40% lower from second-half 2019. While consolidated US demand for all transportation fuels in second-half 2020 was 2 million b/d (12.4%) less than prepandemic levels, second-half 2020 refinery crude runs—the ultimate determinant of crude oil demand—were down 2.7 million b/d (16%) from the last 6 months of 2019.
These trends played out in similar fashion in markets in Europe, India, the Middle East, and—except for China—the Asia Pacific. While less reliable than US Energy Information Administration (EIA) statistics for US crude runs, the data from Joint Oil Data Initiative (JODI) showed global crude runs in second-half 2020 were down 7-8 million b/d from second-half 2019. Until governments worldwide lift all constraints on personal mobility and social activities, demand for transportation fuels will remain 4-6 million b/d (5-8%) below prepandemic levels.
In late-2020, the pending rollout of COVID-19 vaccines sparked a wave of optimism regarding a sustained rebound in transportation-sector demand for refined products. EIA weekly statistics showed US refinery crude runs during January-April 2021 were 1.7 million b/d (10.7%) less than a year earlier. Based on rolling 4-week averages, EIA’s weekly statistics also showed gasoline demand was about 1 million b/d (10.2%) lower from the first 4 months of 2020, with distillate demand down 120,000 b/d (2.9%) and jet fuel demand down 529,000 b/d (32%).
US petrochemical market demand—primarily for ethylene—generally accounts for 75-80% of domestic NGL demand. Until February-March 2021, the global chemical industry fared much better than the global refinery industry.
US ethylene producers, however, experienced two major weather events impacting production and feedstock demand: three hurricanes that made landfall in Lake Charles, La. between August and October 2020and an unprecedented deep freeze in mid-February 2021. These weather events resulted in combined losses of ethylene production of 6.2-6.7 billion lb (8-9%), as well as reduced NGL feedstock demand of 17 million bbl (16%) in second-half 2020 and 47 million bbl (38%) in first-quarter 2021.
Texas ethylene producers returned plants to full operating rates by early April. Unless the 2021 Atlantic hurricane season causes extensive downtime in August-September, Petral Consulting Co. forecasts US ethylene producers will set new production records for the final 8 months of 2021.
EIA weekly statistical reports on US petroleum products markets provide the best current tracking indicators for the pace of US economic recovery from the global pandemic. Based on EIA weekly statistics and its own operator surveys, Petral Consulting estimates domestic demand for refined products will remain below prepandemic volumes until first-half 2022.
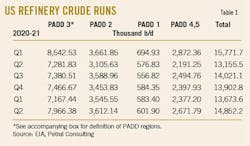
Table 1 shows actual and estimated US refinery crude runs, by region, first-quarter 2020 through second-quarter 2021.
US deep-freeze impacts
The mid-February cold front had a rapidly cascading impact on the stability of the Texas electric power grid. As grid instability threatened to cause power blackouts in all major Texas markets, the Electric Reliability Council of Texas (ERCOT) imposed rolling blackouts.
Before 2020, gas processing companies, in response to increasing pressure from the US Environmental Protection Agency (EPA) to minimize methane emissions, replaced gas-fired compressors and pumps with all-electric systems. ERCOT’s rolling blackouts directly caused many gas processing plants to shut down, which in turn forced oil and gas producers to halt production. EIA reported US oil production between Feb. 14 and Feb. 27, 2021, fell 0.9-1.2 million b/d below the baseline volume of 11 million b/d.. Based on historic gas-to-oil ratios for Texas, rolling blackouts reduced associated gas production by 3.5-4.5 bcfd (18-24%). Gas plant NGL production fell by a similar percentage.
Electric power outages caused downtime for all downstream plants along the Texas Gulf Coast simultaneously. Downtime in refineries and chemical plants prompted reduced demand for gasoline blendstocks and ethylene feedstocks of similar magnitude to supply losses. When the Arctic cold front moved out of Texas and into the southeastern US, ERCOT managed to stabilize the electric power grid. While gas plants returned to service and oil and gas production recovered to late-January 2021 levels, power outages during the week of extreme cold damaged pipes and pumps in most ethylene plants, with many plants not returning to production until late March and early April.
Regional crude production
Since 2016, variations in crude oil and associated gas production have been the dominant variables that determine US gas-plant NGL production volumes, particularly in the key oil producing shale basins (Eagle Ford, Permian, and Bakken). The forward views on crude oil and associated gas production will determine gas plant NGL supply for the immediate future and also affect the midstream distribution system in eastern US markets.
In late 2018, when private equity firms began to adjust their strategic objectives to emphasize profits, rig counts in Texas, New Mexico, and North Dakota began a gradual decline. When governments issued widespread quarantine orders in March-April 2020, demand for refined products collapsed, precipitating a crash in crude oil prices. Oil exploration activity, consequently, also fell sharply.
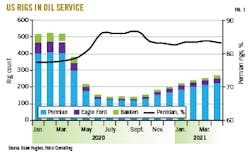
Trends in the rig count for oil-directed drilling activity are the best leading indicators for crude oil, associated gas, and NGL production. During second-half 2014, Baker Hughes weekly rig count reports showed rigs 950 rigs in oil-directed service in Permian, Eagle Ford, and Williston basins. After the Organization for Petroleum Exporting Countries (OPEC) launched another of its market-share initiatives by clearing member countries to ramp up production in October 2014, oil prices crashed, sending the US oil-directed rig count falling during the following six quarters to a low of 199 in second-quarter 2016 (79% lower vs. second-half 2014). During the next ten quarters, the rig count in US key shale plays recovered to 618 in fourth-quarter 2018 (3 times higher from second-quarter 2016). Rigs in oil-directed service declined gradually in 2019 to between 520-525 in fourth-quarter 2019 and first-quarter 2020.
Rig counts in all oil-prone shale basins were in freefall during second-quarter 2020, but some basins fared better than others. The rig counts in Eagle Ford, Niobrara Williston, and Woodford in August 2020 were 80% down from fourth-quarter 2019, while the Permian rig count was off only 70%. Rig counts in the three key US shale plays fell to lows of 140-160 in June- October 2020. When OPEC members and Russia agreed to reduce production to offset the decline in transportation-sector fuel demand caused by the pandemic, oil prices began a modest recovery.
After 5 months at the low of the current cycle, rig counts began increasing in November 2020 (up 24% from the June-October 2020 average), rising 9-11%/month between December 2020 and February 2021 before slowing to 5-6%/month in March-April 2021. The rig count between November 2020-April 2021 increased 122 (82%) from the 2020 low, which was similar in duration (6 months) and rate (82%) to the 2016-17 recovery.
Fig. 1 shows rig counts for the four major US basins from January 2020 to April 2021.
If OPEC+ maintains a disciplined approach to its current oil production agreement, oil prices will be strong enough to support continued recovery of the US shale oil-directed rig count. Based on OPEC’s current regime of fiscal discipline and monthly review of the global crude supply-demand balance, Petral Consulting forecasts US rig counts will likely reach 480-500 in fourth-quarter 2021. Crude production will especially increase in the three major shale plays, which are critical to growth in US gas plant NGL supply.
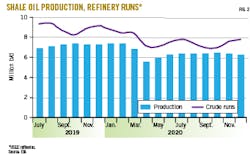
Production in the Permian, Eagle Ford, Bakken, and Niobrara was 6.3-6.5 million b/d in second-half 2020, 1 million b/d (13%) less than peak production in October 2019-January 2020. Permian production during the same period was down 0.3 million b/d (7%) to 3.75-3.85 million b/d.
During the cycle of falling drilling activity and declining output, oil producers actively and voluntarily reduced production to offset the decline in US total demand for crude (domestic crude runs plus USGC exports). Geographically, USGC and Midcontinent refineries determine 88-92% of the domestic market for crude production from the four major shale plays. Demand in fourth-quarter 2020 was down 1.8 million b/d from fourth-quarter 2019, with first-quarter 2021 demand down 1.7 million b/d from the same period in 2020. Refinery crude runs in these two regions in third-quarter 2020 averaged 10.97 million b/d and 10.92 million b/d in the fourth quarter, which was 2 million b/d and 1.6 million b/d lower, respectively, from the same quarters in 2019.
Although less accurate than its delayed monthly statistical data, EIA weekly statistics showed overall US refinery crude runs in January-April 2021 were 11.6-11.8 million b/d, with crude runs in mid-January through mid-February down only 550,000-750,000 b/d from 2020 and 500,000-550.000 b/d from 2019.
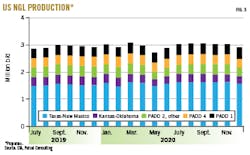
Fig. 2 compares US shale basin production with USGC refinery crude runs.
Regional variations in crude production are important as the drivers for associated gas production and gas-plant throughput rates. These variations are also important because gas quality (NGL content/MMcf) varies. Due to its volume of oil production, however, the Permian basin will be the primary driver of US output for the next 3-5 years.
If Permian rig counts continue to increase, US crude oil production will begin to recover from the pandemic-induced collapse in global demand for refined products. Petral Consulting forecasts Texas crude production from all shale plays and conventional reservoirs will reach 4.8-5.0 million b/d by year-end 2021.
NGL raw-mix, refinery propane production
At publication of this article, NGL production statistics were only available through February 2021. Estimates of propane+ production (NGL raw mix excluding ethane) are therefore based on EIA weekly crude oil production statistics and reasonable estimates for oil production in New Mexico, North Dakota, Oklahoma, and Texas.
Before the collapse in global demand for petroleum products, EIA’s weekly statistics for US oil production were a reasonable first estimate. As the oil price collapse forced producers into survival mode, the weekly oil production statistics became noticeably less reliable as the basis for estimates of propane+ supply. EIA monthly statistics for second-half 2020 showed NGL production from all US gas plants was 5.28 million b/d, up from 5.04 million b/d in first-half 2020 but up from 4.91 million b/d in second-half 2019.
Total NGL supply is an important current indicator for integrated midstream companies’ output because these companies are less dependent on prices and margins. If service fees for pipeline transportation, fractionation, and storage are based on terms and conditions in take-or-pay contracts, even modest growth rates translate into continued growth in gross revenue. Year-over-year growth in NGL production in second-half 2020, however, was not a function of growth in crude oil and associated gas production. Instead, integrated midstream companies increased ethane production based on improvement in ethane-recovery margins.
During second-half 2020, the year-over-year increase in ethylene production boosted industry demand for ethane. Additionally, ethane feedstock buyers ignored downtime in Lake Charles in September-October 2020, providing enough support to keep ethane prices at levels that prevented any major reversion to ethane rejection. Ethane production in second-half 2020 was 2.1 million b/d, up 175,000 b/d from first-half 2020, and accounted for 73% of growth in US NGL production.
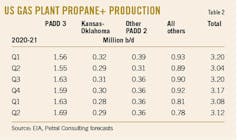
Trends in propane+ production remain a better indicator of growth prospects for the US midstream industry. During second-half 2020, propane+ production was 3.18 million b/d, up from 3.12 million b/d in both first-half 2020 and second-half 2019, accounting for 27% of NGL production growth (Table 2).
Fig. 3 shows US regional gas-plant supply of propane+.
Regionally, crude oil production is the primary driver of NGL production (all components). Ethane production variability occurs due to economic factors that affect only ethane, and we exclude ethane from analysis of crude oil and NGL production trends. Similarly, natural gasoline production for USGC and Midcontinent gas plants is seasonal due to its tendency to condense in gas-gathering pipeline systems. To provide the best statistical analysis, evaluation of NGL supply trends is based on regional trends in crude oil and LPG production (propane plus butanes) for Kansas-Oklahoma, Texas-New Mexico, and the Rocky Mountains.
Crude oil production in Kansas-Oklahoma was 521,800 b/d in second-half 2020, down 145,700 b/d (21.8%) from second half-2019. LPG production, in contrast, was 300,400 b/d in second-half 2020, 36,300 b/d (10.8%) lower from a year earlier. Second-half 2020 crude production in the Rocky Mountains was 789,600 b/d—195,400 b/d (19.8%) less than in 2019—with propane+ production at 353,300 b/d, up 15,900 b/d (4.7%) from second-half 2019. Excluding output from the Gulf of Mexico and Louisiana due to hurricane impacts, second-half 2020 crude production from Texas-New Mexico was 5.71 million b/d, 495,100 b/d lower from second-half 2019. Texas-New Mexico propane+ production during second-half 2020, however, was 1.32 million b/d, up 7,000 b/d from the same period in 2019. In all three regions, LPG production from gas plants outperformed regional crude oil production. Possible explanations for this include associated gas production increasing as crude oil production declined, or associated gas production remaining steady as NGL content increased. From a strictly logical perspective, more NGL-rich gas seems the likely cause.
Petral Consulting expects moderate increases in US oil and NGL production, as rig counts in Texas-New Mexico have increased every month since October 2020 and counts in Williston basin (North Dakota’s Bakken) and Oklahoma’s Cana Woodford also at higher levels higher than in third-quarter 2020. Short-term forecasts for US gas plant production depend entirely on Permian oil production growth, and the region’s steady increase in oil-directed drilling activity supports forecasts for Permian crude production to increase 150,000-250,000 b/d in second-half 2021 and 200,000-300,000 b/d in first-half 2022. Total US gas plant propane+ supply will average 2.8-3.2 million b/d in second-half 2021, while US NGL production (including ethane recovery) will average 5.2-5.5 million b/d during the same two periods.
Ethane recovery, rejection
EIA reported total US gas plant ethane production was 2.1 million b/d in second-half 2020, averaging 174,000 b/d (9.1%) more than in first-half 2020 and 315,000 b/d (17.7%) more than in second-half 2019. Ethane production from USGC gas plants was 1.35 million b/d in second-half 2020, up 100,500 b/d from first-half 2020. Rejection in the USGC was 286,000 b/d in second-half 2020, down 84,500 b/d (22.8%) from the first half of the year, averaging 16.1% of full recovery in third-quarter 2020 and 19% in the fourth quarter.
Ethane production from gas plants in the Rocky Mountains (primarily Colorado-Wyoming) was 155,400 b/d in second-half 2020, 32,000 b/d (26%) higher from first-half 2020. Ethane rejection in the region during second-half 2020 was 155,000 b/d, down 32,000 b/d from first-half 2020 and equal to 44.2% of full recovery in third-quarter 2020 and 56.1% in the fourth quarter.
In Kansas-Oklahoma, ethane production for second-half 2020 was 231,000 b/d, up 16,200 b/d (7.6%) from first-half 2020. Regional gas plants ran at 90% of full recovery in the third quarter before slipping to 83% recovery in the fourth quarter. These plants rejected 27,000 b/d of ethane in the third quarter and 44,600 b/d in the final quarter.
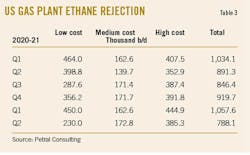
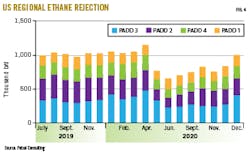
Petral Consulting estimates ethane rejection from all US gas plants in second-half 2020 was 817,000 b/d, 137,000 b/d (14.3%) less than in first-half 2020 (Table 3, Fig. 4).
Gas plants in the USGC, Kansas-Oklahoma, and Rocky Mountains are the most important ethane supply sources for Texas and Louisiana ethylene plants. USGC and Kansas-Oklahoma gas plants supply low-cost ethane, while plants in the Rocky Mountains are intermediate-cost supply sources, and plants in North Dakota, Ohio, West Virginia, and Pennsylvania high-cost supply sources.
During the past 7 years, ethane production was a function of limited by USGC feedstock demand and international exports to ethylene plants in Europe, India, and the Asia Pacific. Production in first-half 2020 was 1.87-2.14 million b/d to average 1.92 million b/d, up 211,000 b/d from third-quarter 2019 and 73,000 b/d from fourth-quarter 2019. Feedstock demand and exports were 2.04 million b/d in first-quarter 2020 before falling to 1.89 million b/d in the second quarter. In second-half 2020 through first-half 2021, Petral Consulting estimates ethane production will average 1.8-2.0 million b/d.
When Saudi Arabian Basic Industries Corp. (SABIC) and ExxonMobil Corp. joint-venture Gulf Coast Growth Ventures LLC commissions its 1.8-million tonne/year (4-billion lb/year) ethane cracking complex in San Patricio County, Tex., near Corpus Christi, in fourth-quarter 2021 or first-quarter 2022, Petral Consulting estimates ethane demand will increase 110,000-130,000 b/d. Texas-New Mexico gas plants, as the low-cost sources of incremental supply, will reduce ethane rejection to 150,000-200,000 b/d in first-half 2022.
NGL market overview
While retail propane sales account for roughly 10% of US NGL demand, three markets account for more than 90% of demand:
- Petrochemical feedstock.
- Gasoline blending.
- International exports.
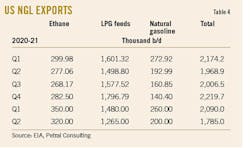
Before 2012, US NGL markets were roughly in balance with similar volumes of imports and exports. As US oil producers began applying horizontal drilling and hydraulic fracturing technology to oil-prone shale plays, US NGL production doubled over 8 years. LPG supply from US gas plants, however, tripled within 10 years. Propane and butane exports were sporadic and seasonal before 2012, but US LPG exports increased to 1 million b/d in 2017 and 1.62 million b/d in 2020 (Table 4). LPG demand in major domestic markets was 2.4-2.8 million b/d in 2020, including 2.1-2.2 million b/d of demand for ethylene feedstock.
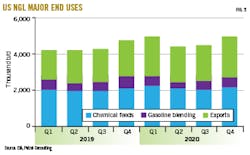
Fig. 5 shows trends in domestic and export demand for US NGL.
Four integrated midstream companies (Enterprise Products Partners LP, Energy Transfer LP, Phillips 66 Partners LP, and Targa Resources Corp.) both produce LPG and operate LPG export terminals on the Upper Texas Gulf Coast. Energy Transfer subsidiary Sunoco Logistic Partners Operations LP operates an LPG export terminal at Marcus Hook, Pa. International buyers and LPG trading companies purchase product from US producers, arrange for shipping, and schedule loading-time slots at the various export terminals.
In second-half 2020, bad news for global oil producers—especially those in the Middle East—and refining companies was good news for US midstream operators with LPG export terminals. Middle East oil production in second-half 2020 was down 2.4-3.0 million b/d from second-half 2019, with Petral Consulting estimates showing Middle East LPG production in second-half 2020 down 270,000-300,000 b/d from the same period in 2019.
Some Middle East producers have domestic LPG markets and do not export all of their LPG produced. Until 2015-16, Middle East propane supply was sufficient to meet growing demand in Asia Pacific chemical feedstocks markets, but continued demand growth in the region gradually increased the need for US-sourced supplies and in second-half 2020, this need increased sharply.
Propane exports from all US LPG export terminals to all destinations in second-half 2020 were 1.32 million b/d, up 164,000 b/d (14.3%) from second-half 2019. Shipments to the Asia Pacific accounted for 55% of all propane exports, with Japan (399,000 b/d) and China (171,000 b/d) the two most important destinations by volume. Exports to European destinations were steady at 170,000-220,000 b/d, with regional ethylene producers the most consistent buyers. Exports to Mexico and various destinations in South America during the period were 250,000-450,000 b/d. Propane exports accounted for 60-70% of total US NGL exports in second-half 2020 and 61% and 73% of US gas plant supply in the third and fourth quarters, respectively.
In second-half 2020, butane exports averaged 360,000-390,000 b/d; exports accounted for 43.6% of US gas plant supply in the third quarter and 40.8% in the fourth quarter. Ethane exports were 260,000-290,000 b/d in second-half 2020, accounting for 12.7% of US ethane production in the third quarter and 13.7% in the fourth quarter. Consolidated exports (ethane, propane, butane) were 1.8 million b/d in the third quarter and 2.1 million b/d in the fourth quarter. Based on these comparisons, and as is true in other regional markets, propane is the most important component of US NGL supply in international trade.
Winter weather during December 2020-March 2021, based on heating degree days data (was slightly colder than the previous year, and Petral Consulting estimates retail propane demand was 8.0-8.5 million bbl higher. Furthermore, US propane exports increased to record-high volumes, with US propane inventory declining 61-62 million bbl and withdrawals measuring 26-28 million bbl more than in the three previous winters. Global propane markets now depend on a steady flow of US propane exports. LPG buyers in the Asia Pacific and Europe—anticipating a US inventory deficit equal to 26-28% of peak inventory at the beginning of winter 2020—should have responded by aggressively buying US propane supply in advance of winter 2021.
In late-March 2021, however, OPEC+ announced plans to increase Middle East crude oil production by 2.0-2.2 million b/d May-July. Anticipating the need for less US imports, buyers stepped back, allowing international LPG prices to fall. As Middle East oil producers increase production in line with OPEC’s revised quota agreements, Middle East LPG production will rebound, and the flow of LPG exports to the Asia Pacific will recover to prepandemic levels.
Simultaneously, Iran and China reached an agreement to exchange Iranian oil for Chinese investments in the Iranian economy. Based on this agreement and Iranian oil production (3.8-4.0 million b/d) prior to various layers of US economic and financial system sanction in 2018-2019, Iran has the potential to increase crude oil exports to China to 1 million b/d within a period of months.
China will begin investing substantial capital into rebuilding Iran’s oil production capability (6 million b/d at the time of the Iranian revolution in 1978) and Iran will increase crude oil exports to China to 2 million b/d within the next few years. OPEC’s Monthly Oil Monitory Report (MOMR) showed Iranian oil production, based on secondary sources, was 1.95 million b/d in third-quarter 2020 and 1.99 million b/d in the fourth quarter. Production increased to 2.1 million b/d in January and reached 2.3 million b/d in March. Production in March was 311,000 b/d more than in fourth-quarter 2020, and the increase in production occurred as Iranian exports to China increased. Within 3 to 12 months, Iran, based on its demonstrated production capacity of 4 million b/d, will increase exports to China to 2 million b/d. If Iran ramps up production and exports within three months, Iranian exports will become disruptive to the fragile global oil market balance Saudi Arabia has diligently managed since June 2020.
In second half 2021, rising oil exports from Iran will have no perceptible impact on international LPG markets. Iran was never more than a minor source of LPG exports. Iran, with a population of 85 million, has a much larger domestic market for propane and butane when compared with the Sunni monarchies on the west side of the Arabian Gulf. In the next two to five years, however, Iranian oil exports to China, presumably based on very favorable pricing terms, have the potential to undermine Saudi Arabia’s control of OPEC and its ability to maintain strict production quota discipline and therefore achieve both objectives of market share and price. The effects of the Iranian agreement with China will add to the Middle East’s inherent instability.
Export to a variety of international markets is the largest end-use for US propane and butane, and chemical feedstock markets (ethylene, propane dehydrogenation, specialty chemicals based on isobutane feed) remain the largest volume market for total US NGL supply (ethane, LPG, natural gasoline). All five NGL components are used as feedstocks in petrochemical production. Normal butane, isobutane, and natural gasoline are used in gasoline blending.
Pandemic-related restrictions on retail economic activity had little impact on US ethylene production and demand for NGL feedstocks. But weather-related downtime and production losses exceeded pandemic-related losses at USGC refineries.
Petrochemical feedstock demand
Petral Consulting determines monthly ethylene production and feedstock demand by conducting an independent monthly survey of plant operating rates and feed slates to track consumption of purity ethane, ethane-propane mix, ethane, and propane contained in refinery offgas, purity propane (HD5), normal butane, natural gasoline, refinery-sourced naphtha, and gas oil.
US ethylene capacity reached 86.4 billion lb/year (236.8 million lb/day) in second-half 2020 and first-quarter 2021. Operable ethylene production capacity remained at the 86-billion lb/year level until late August 2020, when Hurricane Laura caused extensive damage to installations at Lake Charles, La. By late-September, none of the ethylene producers were still reporting extensive damage to ethylene plants or derivative units, but all plants and refineries remained shuttered until widespread damage to the regional electric power grid was fully repaired and power restored. As of Aug. 26, ethylene capacity in Lake Charles stood at 10.1 billion lb/year, accounting for 11.8% of total US capacity and 41% of capacity in Louisiana.
All but one of Lake Charles-area ethylene plants had returned to 90% of full capacity by Nov. 1, 2020, with production returning to 100% capacity in December. Production losses from Aug. 26-Nov. 1 were 1.7 billion lb (57% of expected production if all plants ran at similar rates in May-July). On an annualized basis, Lake Charles hurricane-related production losses reduced production by 18.8%.
While USGC ethylene producers normally have little or no concern about weather-related disruptions to operating rates between November-May, in February 2021, 14 weeks after Lake Charles ethylene plants returned to full production, the intense Arctic blast hitting the southeastern US changed that. Ordinarily, a week of cold weather would be inconvenient for USGC chemical and refinery plants, though regional gas producers would reasonably expect some natural gas wells to freeze. Gas producers, however, have extensive experience with cold weather, and with all weather reports warning of the cold blast at least 2 weeks in advance, gas producers had sufficient time to take appropriate measures ahead of the front’s arrival.
As is usually true with hurricanes, the Arctic cold front itself had limited impact on operability of USGC ethylene plants. But just as hurricanes cause extensive damage to the electric power grid at the point of landfall, the February 2021 deep freeze impacted all Texas electric power consumers simultaneously. As the state’s power grid destabilized, the Electric Reliability Council of Texas (ERCOT) mandated rolling blackouts to limit demand and offset unexpected losses in power generation from gas-fired generating plants to avoid a complete grid collapse. These blackouts had a disproportionate impact on Texas Gulf Coast refineries, chemical plants, and gas processing plants, as well as on Texas oil and gas producers.
When ERCOT applied rolling blackouts to West Texas consumers as well, many gas processing plants were forced to shut down, compelling oil and gas producers to shutter production. The problems continued to cascade as natural gas deliveries into intrastate pipelines fell. Intrastate pipelines then imposed supply allocation rules, curtailing gas deliveries to the lowest-priority customers, which included industrial and power-generation plants. As gas supply to power generation plants declined, total power supply into the ERCOT grid further declined. Within 48 hours, electric power blackouts caused producers to shutter ethylene plants and refineries throughout Texas. A few Texas ethylene plants had returned to service by mid-March 2021, but most plants did not resume full operations until late March or early April.
Feedstock demand for NGL feeds (ethane, propane, normal butane, natural gasoline) was 1.85-2.14 million b/d in first-half 2020, 2.08 million b/d in the first quarter and 1.97 million b/d in the second quarter. Demand for NGL feeds reached record-high volumes in first-half 2020, the global economic shutdown having limited impact on US chemical production.
In second-half 2020, NGL feed demand was 1.91 million b/d in the third quarter and 2.01 million b/d in the following quarter. Despite the 2-month downtime for Lake Charles ethylene plants, third-quarter 2020 feed demand was 31,000 b/d higher from third-quarter 2019 but 53,000 b/d down from second-quarter 2020 and 150,000 b/d lower from first-quarter 2020. Ethylene producers operated at 82% of nameplate capacity in third-quarter 2020 and 87% in the fourth quarter.
Because of first-quarter 2021’s weather-related interruption of the power grid, every Texas ethylene plant experienced major downtime in February-March, reducing demand for NGL feeds by 425,000-435,000 b/d from a January 2021 demand of 2.11 million b/d. Demand averaged only 1.39 million b/d in February 2021 and 1.31 million b/d in March.
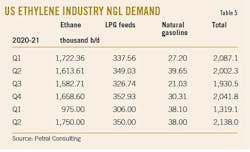
Second-half 2020 ethane demand was 1.58-1.66 million b/d before increasing to 1.77 million b/d in January 2021. Ethane accounted for 78% of demand for all NGL feeds in second-half 2020 and January 2021. In third-quarter 2020, ethylene producers used 353,000 b/d of LPG feeds and 341,000 b/d in the fourth quarter, with LPG feeds accounting for 16.4% of second-half 2020 demand. LPG feed demand was steady in January 2021 at 341,000 b/d before falling to 250,000-275,000 b/d in February-March, leaving LPG feeds to account for 17% of all first-quarter 2021 demand (Table 5).
Downtime for Texas ethylene plants reduced ethylene production by 4.5-5.0 billion lb relative to what production would have been if all plants had operated at 91% capacity, with total weather-related production losses at 6.2-6.7 billion lb. To make up for February-March 2021 losses, Petral Consulting expects USGC ethylene producers to run plants at 92-95% of nameplate capacity during second and third-quarters 2021 for an average NGL feed demand of 2.0-2.2 million b/d.
Refinery butane demand
Gasoline production is the number one factor in determining refinery demand for butanes and natural gasoline. In third-quarter 2020, gasoline production fell 1.05 million b/d (10.4%) from the same period in 2019. Fourth-quarter 2020 production was 1.18 million b/d (11.6%) lower from fourth-quarter 2019. Based on EIA weekly statistics, first-quarter 2021 gasoline production was about 0.92 million b/d (9.9%) below the same quarter in 2020.
At the time of writing, EIA statistics on refinery demand for gas-plant normal butane were available for all months of the 5-month winter 2020 RVP-blending season (September 2020-February 2021). Based on EIA weekly statistics, we know US gasoline demand remained 10% below prepandemic levels between January-April 2021. Downtime at USGC and Midcontinent refineries caused by weather-related power outages left crude runs in late February-March 2021 2.0-2.5 million b/d lower from January and early February, reducing gasoline production in the same period by 1.5-3.0 million b/d.
During April-August 2020, US refineries produced gasoline to meet summer RVP specifications. Since gasoline demand for normal butane was already at seasonally minimum levels, the full impact of pandemic-related reductions to refinery operating rates and gasoline production did not emerge until September-October. Consistent with reduced gasoline production rates, EIA statistics showed refinery demand for gas-plant normal butane for RVP blending in winter 2020 was 7.3 million bbl (9.0%) down from winter 2019. During this same period, refinery demand for isobutane was down 5.7 million bbl (14.5%) from winter 2019, while refinery demand for natural gasoline in second-half 2020 was up 2.2 million bbl (12.4%) from first-half 2020.
Near-term outlook
JODI data for second-half 2020 showed global refinery crude runs in third and fourth-quarters 2020 were 7.7-7.8-million b/d (10.4%) less than second-half 2019. Although JODI data for first-quarter 2021 remains unavailable, EIA data showed the pandemic’s impact on refined products demand and US crude runs was persistently 8-10%. Considering various governments in Europe and the Asia Pacific have not lifted various pandemic-related restrictions, Petral Consulting forecasts global refined products demand will remain 5-10% below 2019 volumes in third and fourth-quarters 2021.
In the US, while many state and local governments have lifted formal limits on public social gatherings, many major companies will continue allowing employees to work remotely or rotate between corporate offices and remote work locations. Given a large volume of the population also remains cautious about rubbing elbows with strangers, psychological effects of pandemic-related lockdowns may linger indefinitely.
If Russia and OPEC’s official members continue to limit oil production to maintain reasonable market balances in the Asia Pacific and Europe, the risk of another crash in oil prices will discourage US oil producers from reverting to the policy of aggressively increasing oil production.
Based on its 25-year agreement with Iran, China will immediately begin investing substantial capital into rebuilding Iran’s oil production capability (6 million b/d at the time of the Iranian revolution in 1978). During the next few years and perhaps during second half 2021, Iran will increase crude oil exports to China to 2 million b/d.
This agreement has already begun to impact Middle East oil production and exports. OPEC’s Monthly Oil Monitoring Report (MOMR) showed Iranian oil production, based on secondary sources, was 1.95 million b/d in third-quarter 2020 and 1.99 million b/d in the fourth quarter. Production increased to 2.1 million b/d in January and reached 2.3 million b/d in March. Production in March was 311,000 b/d more than in fourth-quarter 2020, and the increase in production occurred as Iranian exports to China commenced. As Iran continues ramping up crude oil production and exports to China, Iranian exports will become disruptive to the fragile global oil market balance Saudi Arabia has diligently managed since June 2020.
In second half 2021, rising oil exports from Iran will have no perceptible impact on international LPG markets. Iran was never more than a minor source of LPG exports. Iran, with a population of 85 million, has a much larger domestic market for propane and butane when compared with the Sunni monarchies on the west side of the Arabian Gulf. In the next two to five years, however, Iranian oil exports to China, presumably based on very favorable pricing terms, have the potential to undermine Saudi Arabia’s control of OPEC and its ability to maintain strict production quota discipline and therefore achieve both objectives of market share and price. The effects of the Iranian agreement with China will add to the Middle East’s inherent instability.
If refinery crude runs in the Asia Pacific and Middle East increase in tandem with rising OPEC oil production, refinery naphtha supply for Asian-Pacific ethylene plants will increase, as will Middle East LPG supply. We can reasonably expect Asian-Pacific buyers to take advantage of this improvement in overall feedstock supply.
For US midstream companies, however, a sustained rebound in ethylene production in second-half 2021 and first-half 2022 exceeds the importance of developments in international LPG markets. While US ethylene producers busily repaired damages caused by the deep freeze and blackouts of February 2021, ethane prices remained remarkably stable, with ethane production probably surplus to demand for 6 weeks.
EIA’s January 2021 monthly report showed ethane inventory in USGC storage on Feb. 1 fell to 55 million, down 15 million bbl (21%) from Nov. 1, 2020. The drop in ethane inventory incentivized USGC ethylene feedstock buyers—anticipating all plants would be in service in second-quarter 2021—to allow surplus supply to rebuild inventory during February-March.
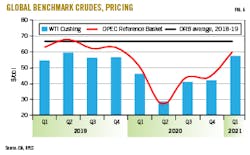
Midstream companies will also benefit from rebounding West Texas gas-plant NGL production and moderate growth in Texas-New Mexico NGL production during the next 18-24 months. Following OPEC’s December 2020 change in policy regarding adjustments to its production agreement, oil prices—including West Texas Intermediate (WTI) and OPEC Reference Basket (ORB) grades—averaged $60/bbl in first-quarter 2021 (Fig. 6).
Until global demand has recovered to prepandemic levels and all OPEC members countries are allowed to produce at full capacity, OPEC oil ministers will reset production quotas on a monthly basis with the provision that monthly changes (up or down) will not exceed 500,000 b/d. Following Saudi Arabia’s voluntarily commitment to reduce its crude production by an additional 1 million b/d in first-quarter 2021, Saudi production fell to 8.1 million b/d in February and 8.0 million b/d in March compared to 8.96 million b/d in fourth-quarter 2020.
JODI data showed no major change in global refinery crude runs in fourth-quarter 2020, and EIA statistics showed US refined products demand in first-quarter 2021 remained 10% below prepandemic levels. In the first 10 trading days of April 2021, crude buyers and international crude traders did not react bearishly to OPEC’s plan to increase production 2.1 million b/d during May-July.
As OPEC implements the decision to increase production by 2 million b/d and Iran increases production to its historic maximum (3.8-4.0 million b/d) to meet its 2-million b/d commitment of exports to China, total second-quarter 2021 production in the Middle East will reach 98% of first-quarter 2020 volumes.
OPEC may be counting on the seasonal demand increase typical during the second and third quarters of the annual cycle, but only time will tell if this comes to pass. This year, a large fraction of the US workforce will continue to work from home at least half the time, with tight budgets also limiting the number of families taking long road trips. If these considerations prevent US demand from recovering to prepandemic levels, similar considerations are likely to limit global demand recovery.
OPEC’s decision to increase production is good news for global economic growth, and OPEC needs a sustained economic recovery to support fiscal and revenue requirements of all member countries. Good news for global consumers, however, has elements of bad news for the US midstream industry. As Middle East producers increase crude oil production, NGL production will recover in parallel and simultaneously, prompting buyers in the Asia Pacific to reduce purchases from US producers. US exports to Europe may also slip below second-half 2020 volumes.
The author
Daniel L. Lippe ([email protected]) is president of Petral Consulting Co., which he founded in 1988. He has expertise in economic analysis of a broad spectrum of petroleum products including crude oil and refined products, natural gas, natural gas liquids, other ethylene feedstocks, and primary petrochemicals.
Lippe began his professional career in 1974 with Diamond Shamrock Chemical Co., moved into professional consulting in 1979, and has served petroleum, midstream, and petrochemical industry clients since. He holds a BS (1974) in chemical engineering from Texas A&M University and an MBA (1981) from Houston Baptist University. He is an active member of the Gas Processors Suppliers Association.
