USGC olefins producers endure pandemic, record hurricane season
Dan Lippe
Petral Consulting Co.
Houston
In second-half 2020, US Gulf Coast (USGC) ethylene producers faced the unprecedented task of simultaneously surviving an ongoing global pandemic and the region’s most active hurricane season on record.
By mid-2020, as the second and third waves of the coronavirus (COVID-19) crashed upon the shores of the Asia Pacific, Europe, and North America, governments around the world responded by imposing lockdown regulations, requiring businesses to allow nonessential employees to work remotely. COVID-19’s varying impacts on refinery and olefins plant operating rates, as well as its downward pressure on demand for petroleum-derived products, proved sources of discussion for petrochemical companies during virtual video meetings, but it was only a minor inconvenience for chemical producers heading into the second half of the year.
While USGC ethylene operators were weathering COVID-19-related impacts far better than their regional refining counterparts, things drastically changed with the arrival of the 2020 Atlantic hurricane season that—between June 1 and Nov. 30, 2020—included five hurricanes making landfall in Louisiana, three of which directly struck the regional ethylene-production hub of Lake Charles, La. These storms caused extensive damage to the electric power grid, forcing all ethylene capacity in southwest Louisiana out of service during September-October.
Despite the emergence of a second major COVID-19 variant in the UK during first-quarter 2021, the impact of the pandemic on refining and chemical producers is now reasonably predictable: it will continue to limit transportation-sector demand for refined products and refinery operating rates. But the 2021 hurricane season is only months away.
Ethylene production
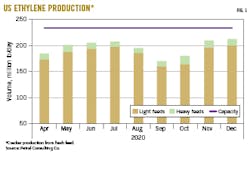
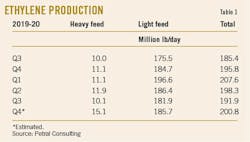
Petral Consulting Co. tracks US ethylene production via a monthly survey of operating rates and feed slates. In first-half 2020, USGC chemical companies produced nearly 37 billion lb of ethylene, with output 2.5 billion lb/year (7.3%) more than in 2019 (Table 1). While first-half 2020 global responses to COVID-19—including lockdown of retail economic activity—slowed the rate of growth in exports of polyethylene and ethylene glycol, chemical producers still operated at 84-88% of capacity during the period.
Smooth sailing through second-half 2020, however, was not to be. Instead, USGC olefins producers were forced to cope with downtime resulting from three back-to-back hurricanes from late-August through mid-October. By the time Theta—the last-named storm—emerged in the North Atlantic on Nov. 10, 2020, olefins producers in southwest Louisiana had emerged intact from the most active Atlantic-basin hurricane season ever.
Louisiana plants
Lake Charles is home to six ethylene plants with a combined capacity of 10.1 billion lb/year (27.8 million lb/day). During January-July 2020, these Lake Charles plants operated at 88% of nameplate capacity for a total ethylene production of 25 million lb/day. Between late-August and early November 2020, power outages caused most southwest Louisiana plants 60-65 days of downtime, but none of these plants suffered damage extending downtime beyond the period in which power was unavailable. Two plants restarted in late-October 2020, with the remaining four plants resuming production Oct. 31-Nov. 2, 2020. Lake Charles operating capacity ran at 72% in August, 0% in September, and 9% in October, with capacity utilization rates increasing to 72.5% in November and 84% in December.
Laura, the first hurricane to make landfall in southwest Louisiana, caused extensive damage to the electric power grid, with subsequent hurricanes delaying repairs and causing damage to sections that had already been repaired. Since ethylene and derivatives plants require electric power to operate, only one plant in Lake Charles resumed service before Oct. 31, 2020, and one was still offline at the time of this writing.
Combined, Louisiana’s ethylene plants have a total production capacity of 24.4 billion lb/year (66.8 million lb/day). Plants in Louisiana’s River Corridor (Baton Rouge to New Orleans) have a capacity of 14.2 billion lb/year (39 million lb/day). Operating rates for these plants averaged 90-91% in August-September 2020 before dipping to 82% in October and rebounding to 95% in November-December 2020.
Texas plants
Based on geography and ethylene pipeline infrastructure, Petral Consulting’s monthly survey tracks production and feedstocks at Texas plants for two subregions: Upper Texas Coast and South Texas. Upper Texas Coast plants in the Houston Ship Channel, Orange, Tex., and Beaumont-Port Arthur, Tex. areas are substantially more interconnected than plants in South Texas (Corpus Christi to Point Comfort, Tex.). In some respects, plants in Orange and Beaumont-Port Arthur are also interconnected with plants in Lake Charles, but geography takes precedence in ongoing analysis of regional ethylene supply trends. Since plants in Orange and Beaumont-Port Arthur are 36 miles and 56-57 miles, respectively, from downtown Lake Charles, any hurricane of reasonable size landing in the region theoretically would also impact these plants via wind, rain, or storm surge.
Combined, ethylene plants in the Upper Texas Coast and South Texas have a production capacity of 58.6 billion lb/year (160.6 million lb/day). One plant in the Orange and Beaumont-Port Arthur area remained offline until mid-December, but this extra downtime resulted from planned work needed to complete an incremental expansion of capacity.
Ethylene producers generally operate to meet daily, weekly, or monthly sales volumes of mainstream derivatives, with polyethylene the most important global commodity for USGC producers. As a solid, polyethylene pellets are shipped in bulk via container vessels. Ethylene glycol, a liquid, is also an important derivative for the global ethylene market.
During second-half 2020, ethylene production from Texas plants was consistent, with either limited or no growth in polyethylene and ethylene glycol exports. Downtime in Louisiana plants did not create any short-term opportunities for plants in Texas. Since electric power outages caused all plants to shut down, southwest Louisiana’s market remained in balance, with no ethylene transfers required from Texas.
In second-half 2020, Texas ethylene plants produced within a range of 125-145 million lb/day, with third-quarter production averaging 134 million lb/day and fourth-quarter 142 million lb/day. During third and fourth-quarters 2020, Texas plants operated at 83.5% and 88.3% capacity, respectively.
Fig. 1 shows trends in ethylene production.
Expansions, new plants
During first-quarter 2020, construction was well under way on three new US ethane crackers:
- Royal Dutch Shell PLC subsidiary Shell Chemical Appalachia LLC’s dual 1.5-million tonne/year (tpy) ethylene and 1.6-million tpy polyethylene complex along the Ohio River in Potter Township, Beaver County, Pa., about 30 miles northwest of Pittsburgh (OGJ Online, Oct. 10, 2018).
- Saudi Arabian Basic Industries Corp. (SABIC) and ExxonMobil Corp. joint-venture Gulf Coast Growth Ventures LLC’s (GCGV) 1.8-million tpy ethane cracking complex in San Patricio County, Tex., near Corpus Christi (OGJ Online, June 26, 2019).
- Bayport Polymers LLC’s (Baystar)—an equal JV of Total SA’s Total Petrochemicals & Refining USA Inc. and the Borealis AG-Nova Chemicals Inc. JV Novealis Holdings LLC—1-million tpy ethane steam cracker in Port Arthur, as well as its 625,000-tpy polyethylene plant in Pasadena, Tex. (OGJ Online, Mar. 1, 2019).
While two of the grassroots ethylene plants were scheduled for mechanical completion by yearend 2022, pandemic-related lockdowns instituted during March were impacting construction timelines. In mid-March 2020, threat of the spreading COVID-19 virus forced Shell to halt construction of the Beaver County complex, which previously was slated for completion by yearend 2021 (OGJ, Aug. 3, 2020, p. 35). While Shell has yet to confirm details regarding current construction progress on the project, the operator said in its latest investors’ handbook published in mid-April 2020 that it expects the western Pennsylvania complex to begin commercial production “early this decade.”
GCGV and Baystar also have yet to update timelines for their respective projects, but evidence clearly supports the conclusion that the pandemic has delayed construction of all new plants.
As of July 1, 2020, US nameplate ethylene capacity was 86 billion lb/year (234.4 million lb/day) and will remain at this level until late 2022.
Global turmoil, pricing
After oil prices collapsed in March-April 2020, Saudi Arabia convinced fellow Organization of Petroleum Exporting Countries (OPEC) producers as well as some non-OPEC members (including Russia and a few key producers such as Norway) to curtail oil production by 6-8 million b/d. Once the revised production curtailment agreement was in force, inventories fell and oil prices recovered. In international markets, Brent and OPEC Reference Basket (ORB) prices were $40-45/bbl in July-November 2020, holding premiums of $0.50-1.50/bbl to West Texas Intermediate (WTI) prices in Houston. During March-May 2020—a period of extreme price volatility—the Brent price volatility index was 6-14% (based on daily price changes) before narrowing to a 1.8-2.8% range in July-December 2020. This narrowing price volatility during second-half 2020 aligns with a more reasonably balanced market.
Unexpected changes in geopolitical relationships within the Middle East have been some of the most consistent factors to tip pricing trends into periods of extreme volatility. During the first 5 trading days of January 2021, however, crude trading and price trends were most influenced by fallout from the November 2020 elections. While Brent prices jumped to $53-56/bbl, the price volatility index during the first 10 trading days of January 2021 was at the lower end of its normal range, even though prices were $10-13/bbl (20-25%) higher than in July-November 2020.
Demand for oil remains a function of refinery crude runs, which in turn is based on transportation fuel demand. Before OPEC’s December 2020 meeting, some speculative traders in the New York Mercantile Exchange (NYMEX) crude futures market maintained moderately bearish perspectives on price trends for first-half 2021. Political uncertainty during December 2020 and early January 2021 amid the possibility of civil unrest in Washington, DC, during the Jan. 20 inauguration provided the bullish spark for a 20% rally in international benchmark crude prices. With moderate fundamental support, bearish speculative traders were unwilling to increase short positions. Bullish speculative traders, meanwhile, focused on political uncertainty in extending long contract positions by 7%. Trends in speculative trading of the NYMEX crude futures contract also reinforced bullish pressure on prices during January 2021’s first 10 days.
When oil prices are in a period of unusually high volatility, prices for feedstocks derived from crude oil (naphtha, gas oil) will also be more volatile than usual. Fortunately for USGC ethylene producers, pricing volatility for all major feedstocks (ethane, propane) remained within historically average ranges.
Ethylene production costs
Ethylene production costs are determined by raw material costs and coproduct credits. Based on variations in yield patterns for the various feeds, coproduct volumes range widely between the three categories of plants (ethane-only, LPG-only, and multifeed plants). Of these three categories, only producers with multifeed plants actively manage the mix of feeds in response to changes in variable production costs for ethane, propane, and heavy feeds.
Raw material costs are determined by each feedstock’s price and its conversion to ethylene. Similarly, coproduct credits are determined by spot prices and production volumes for each coproduct but only for those plants that upgrade all coproduct streams to meet purity specifications.
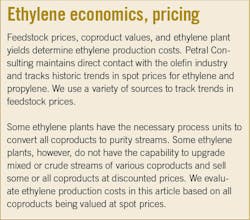
A few ethylene plants can upgrade all coproducts to purity streams and sell all coproducts at market prices. Most ethylene plants produce purity coproduct propylene but produce all other coproducts as mixtures (mixed butylene-butadiene and mixed aromatics) and sell mixtures at discounted prices. Variations in realized revenue for coproducts result in large differences in coproduct credits from one plant to another. Cash production costs are determined by simple addition of raw material costs and coproduct credits (see accompanying box).
Crude oil prices greatly influence prices (directly or indirectly via the value of one feedstock as a substitute for another) for most feedstocks and coproducts and are especially important as the primary driver for naphtha, propane, normal butane, propylene, and aromatics.
In second-half 2020, prices for major crude benchmarks Brent, ORB, and WTI were unusually stable, varying within a narrow range of $40-45/bbl in July-November. When Saudi Arabia and other key members of OPEC+ agreed in December 2020 to adjust the production curtailment agreement monthly beginning in January 2021, fears of surplus supplies in first-quarter 2021 dissipated, increasing prices to $48-50/bbl by end-December.
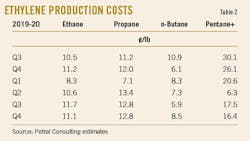
Ethylene production costs (variable costs) based on ethane and propane during second-half 2020 were 7-9¢/lb, while costs based on natural gasoline were 7-14¢/lb (Table 2). With net transaction prices (NTP)— an important pricing variable in ethylene supply contracts as well as the primary consideration for internal transfer price agreements—at 25-32¢/lb during the same period, ethylene producers operating on a vertically integrated basis generated reasonable profit margins on all feeds.
For ethylene producers, the party continued into January 2021. NTP prices remained strong, and ethane-based variable production costs remained at 7¢/lb. Although costs based on other feedstock jumped sharply, ethane-based profit margins are the critical parameter for industry profitability.
Petral Consulting routinely estimates ethane rejection volumes. In first-half 2020, ethane rejection in US low-cost basins (Kansas-Oklahoma, New Mexico, Texas) was 400,000-475,000 b/d before slipping to 275,000-325,000 b/d in second-half 2020. Ethane recovery from these basins during second-half 2020 increased 60,000-120,000 b/d. If ethane prices were weaker in September-October 2020, perhaps ethane rejection would have been about the same. Instead, ethane inventory surged 24 million bbl in August-October.
When ethane is rejected, it is gone forever. When excess ethane is produced, it accumulates in storage and serves the important purpose of extending stable ethane prices. Based on 250,000 b/d of ethane rejection through yearend 2021, USGC ethylene producers have sufficient ethane availability to accommodate anticipated 2021 demand, as well as enough supply to meet demand should two of the three new US plants under construction reach startup in 2022-23.
Ethylene pricing, profit margins
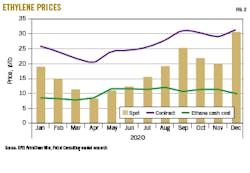
While weakness in spot ethylene pricing during first-half 2020 spilled over into July 2020, second-half 2020 spot prices gradually strengthened from 19-22¢/lb to 22-26¢/lb in September and 25-32¢/lb in December.
While December pricing in any year is notoriously unreliable as an indicator of the spot market’s supply-demand balance, the monthly increase of as much as10¢/lb in December 2020 was a reliable indicator of a period of continued strength. Prices in the first 3-5 trading days of January 2020 increased an additional 12-14¢/lb. Pricing data published by OPIS PetroChem Wire showed spot ethylene prices were 43-45¢/lb—more than double spot prices in mid-November 2020—at Texas pricing points for 10 trading days in January 2021. Petral Consulting’s statistical review suggests the surge in propane, normal butane. and natural gasoline spot prices could have been a factor. Propane and natural gasoline spot prices, however, increased only 2-3¢/lb, so we must dismiss rising production costs as the cause.
Unplanned supply disruptions, then, most likely caused higher ethylene spot prices during the period. A week before Christmas 2020, one fully integrated ethylene producer in South Texas experienced a major maintenance problem with its recently commissioned plant, while another big plant in the Houston Ship Channel experienced 6 days of unplanned downtime Jan. 6-11, 2021. The January 2021 price surge strongly indicates that both operators—to offset production losses from their own plants—were very active buyers in the ethylene spot markets in Mont Belvieu, Tex., during the first 10-12 trading days of the month. Estimated supply losses for mid-December 2020 through mid-January 2021 were 16-18 million lb/day, about 35% smaller than supply losses caused by hurricanes hitting southwest Louisiana in September-October 2020.
Anytime a major producer must buy product in the spot market, other producers take advantage of the opportunity to book sales at higher prices. When two major producers simultaneously enter the spot market, the party begins for competing producers. Since several other producers were operating below full-capacity rates, some of them probably increased production to take advantage of the spike in spot prices.
NTP prices result from extensive negotiations between a group of producers and buyers and are frequently settled retroactively. From this perspective, NTP prices are more important than spot prices. During third-quarter 2020, negotiated settlements for NTP prices increased monthly, settling at 25.5¢/lb in July and 31¢/lb in September. Margins (NTP prices minus ethane-based cash costs) reached 24¢/lb in September vs. 17.8¢/lb in July.
NTP negotiations in fourth-quarter 2020 kicked off with reductions of 75¢/lb in both October and November before wrapping up earlier than usual in December to settle at 31.25¢/lb. Many observers were inclined to expect a substantial increase in NTP for January 2021, but spot prices began to decline just after mid-month. NTP for January were yet to settle by the time of publication.
During second-half 2020, profit margins based on ethane and propane cash costs were positive in third and fourth-quarters 2020, increasing 3-7¢/lb from first-half 2020. Margins for ethane varied within a 13-21¢/lb range, while margins for propane varied between 12-19¢/lb. Margins for natural gasoline and light naphtha of similar quality strengthened 2¢/lb from first-half 2020 and were 4-6¢/lb less than ethane and propane margins.
Fig. 2 shows historical trends in ethylene spot prices and NTPs.
Olefin-plant feed slate trends
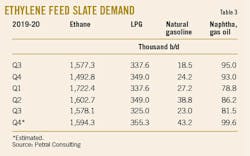
Petral Consulting’s monthly survey of plant operating rates and feed slates showed industry demand for light feedstocks (ethane, propane, and normal butane) was 1.93-1.95 million b/d in second-half 2020, down 79,700 b/d from demand in first-half 2020. Light feed demand fell to 1.70-1.71 million lb/day in September-October amid hurricane-related downtime. If peak-season hurricanes had made landfall somewhere other than Lake Charles, light feed demand would have averaged 2.05-2.15 million b/d in second-half 2020.
During July and August, ethane demand was 1.76 million b/d and 1.62 million b/d, respectively. All ethylene plants in Lake Charles are light feed plants, most of which crack ethane. Following reopening of east-bound traffic on I-10 in the wake of Hurricane Laura’s landfall in Lake Charles, the author was able to observe how extensively the storm had damaged the region’s electric power grid. Based on collective experience with time required to repair major damage to an electric power grid as large as southwest Louisiana’s, no one expected ethylene production to resume before end-September or early October 2020. The second and third hurricanes delayed repairs to the power grid by only 30 days.
Demand for ethane slumped to 1.37 million b/d in September and 1.39 million b/d in October 2020. Once repairs to the power grid were completed, plants ran at full rates, with demand rebounding to 1.72 million b/d in November and 1.71 million b/d in December.
Since Lake Charles ethylene plants do not consume large volumes of propane or normal butane, variations in variable ethylene production costs (light vs. heavy feeds) were the only factors influencing demand for LPG feeds. Ethylene producers consumed 310,000-350,000 b/d of LPG feeds (propane, normal butane) in third-quarter 2020 and 320,000-375,000 b/d in the fourth quarter. Seasonal considerations are normally bearish for normal-butane feedstock demand. When refineries shift to producing winter-grade motor gasoline, demand for normal butane jumps sharply from late-August through December. Many ethylene producers who are consistent consumers of normal butane in the offseason months are also integrated with refineries. Because normal butane availability drops and prices (usually) increase, ethylene producers reduce their consumption.
In second-half 2020, USGC refineries ran at 82-86% of 2019 crude runs, while gasoline production was 84-86% of 2019. With less gasoline, RVP-blending demand should have been less too. Fourth-quarter 2020 feedstock demand for normal butane, however, was 90,000-95,000 b/d, down only 7,900 b/d from the previous quarter.
Table 3 shows trends in ethylene feedstock demand.
Monomer exports
Producers, international traders, and midstream companies perhaps expected exports of ethylene monomer to boom in 2020 following mechanical completion of Enterprise Products Partners LP and Navigator Holdings Ltd.’s 50-50 JV marine terminal at Morgan’s Point, Tex., in late 2019 (OGJ Online, Jan. 8, 2020). During 2015-18, US International Trade Commission (ITC) data showed monomer exports on a quarterly basis varied within a range of zero to 1.6 million lb/day. In 2019, monomer exports were more consistent, averaging 1.98 million lb/day in the first 6 months of the year and 1.75 million lb/day during the latter half. After a slow start in first-quarter 2020 (2.4 million lb/day), monomer exports found positive traction, increasing to 3.9 million lb/day in the second quarter and 5.2 million lb/day in the third quarter. If three hurricanes in September-October 2020 had not disrupted shipping, exports might have reached 6 million lb/day. Despite hurricane-related problems, monomer exports were 3.6-4.6 million lb/day in September-November 2020.
In July-November 2020, ethylene monomer shipments to plants in the Asia Pacific accounted for 87% of total exports. Monomer exports in second-half 2020 equaled 50% of nameplate capacity of one new 3.3-3.5 billion lb/year plant and were more than double the 3-year average. Moving forward, ethylene marketing managers should expect to see continued growth in ethylene exports, with construction of specially designed, new cryogenic vessels the primary constraint for the next 3-5 years.
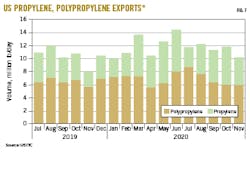
Unlike ethylene monomer exports, propylene monomer exports are not limited by specially designed cryogenic storage tanks and terminals. Instead, propylene monomer exports share capacity with propane and butane at the various USGC export terminals. During first-half 2020, propylene monomer exports were 2.8-6.4 million lb/day, averaging 6.0-6.4 million lb/day for three of those months (March, May, and June). After falling sharply in July, exports were 4.1 million lb/day in third-quarter 2020 and 4.5-5.0 million lb/day in the fourth quarter. Second-half 2020 exports (based on July-November data) totaled 835.5 million lb, which was 81.5 million lb (8.9%) lower than first-half 2020 but up 130.7 million lb (18.5%) from second-half 2019. The year-over-year increase in propylene exports likely was supported by stable prices for polymer-grade propylene and persistently weak prices for refinery-grade propylene.
The bulk of US propylene monomer exports historically were delivered to Mexico and Colombia. In second-half 2020 (July-November), exports to Mexico averaged 2.04 million lb/day and Colombia 2.15 million lb/day, up 0.34 million lb/day (19.8%) and 0.27 million lb/day (14.1%), respectively, from the first half of the year. Exports to both countries also posted strong growth from 2019, with second-half 2020 exports to Mexico up 0.33 million lb/day (19.3%) and Colombia up 0.64 million lb/day (42.6%) from the same period a year earlier.
Polyethylene exports
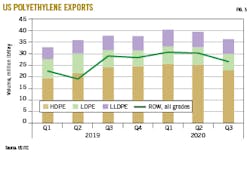
COVID-19 had a sustained impact on global demand for transportation fuels, but the slump in demand for gasoline, diesel, and jet fuels was of little consequence for producers of primary olefins. While the ongoing impact on refined products is obvious, polyethylene exports are critical to profitability for all new ethylene and polyethylene capacity that came on stream in 2017-19. More importantly, polyethylene exports to destinations outside North America are critical. According to US ITC statistics for second-half 2019, exports to all destinations were 37-40 million lb/day in second-half 2019, reaching 42.7 million lb/day in February and 44.1 million lb/day in June of that year. While exports to all destinations averaged 39.8 million lb/day in first-half 2020, exports to all destinations were 36.1 million lb/day in third-quarter 2020, 3.3 million lb/day (8.4%) less than in the second quarter. Exports continued to decline to 30.6 million lb/day in October, before rebounding slightly to 32.3 million lb/day in November 2020. Power outages in southwest Louisiana resulted in 60 days downtime for all polyethylene plants in the area, likely accounting for the drop in exports during August-October 2020.
Using the second-quarter 2020 average as a basis, exports were 6.4 million lb/day (25.6%) less than ethylene production in Lake Charles during first-half 2020. Polyethylene production is generally 50-55% of ethylene production and would have been 12-13 million lb/day less than in first-half 2020 during September-October 2020. Production losses from Lake Charles polyethylene plants probably accounted for a major share of the drop in exports.
As noted in recent analyses of olefins industry market trends, exports to all other destinations (ROW) are important as an indicator of the current health of the USGC olefins industry. During first-half 2020, exports to ROW destinations were about 29.2 million lb/day, up 1 million lb/day from second-half 2019. Third-quarter 2020 exports were 26.1 million lb/day, down 4 million lb/day from first-half 2020 (Table 3). Exports to ROW destinations fell to 23.3 million lb/day in September 2020 and 19.9 million lb/day in October. As plants in Lake Charles resumed production, ROW exports recovered to 22.4 million lb/day.
Fig. 3 shows US exports for the three primary grades of polyethylene.
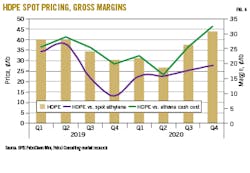
The supply chain margin (polyethylene price minus ethylene production cost) is a useful indicator of profitability of those producers who are vertically integrated and produce ethylene as a raw material for their ethylene derivatives plants. Petral Consulting tracks spot prices for high-density polyethylene (HDPE) and gross margins (HDPE prices minus ethylene cash costs based on ethane). In early first-half 2020, HDPE-ethane margins were 20-25¢/lb before weakening to 13-18¢/lb in the second quarter. As HDPE spot prices increased between June and July 2020, HDPE-ethane margins improved to 31-33¢/lb in October-November and reached 34-35¢/lb in December. With margins averaging 29¢/lb, second-half 2020 was 10¢/lb better than first-half 2020 and almost as good as margins in second-half 2019. The rebound in polyethylene prices and gross margins is a favorable short-term indicator for USGC integrated ethylene producers.
Fig. 4 shows pricing and margin trends for high-density polyethylene (HDPE).
Propylene supply
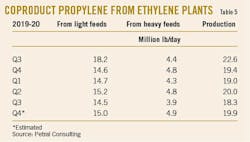
Olefin-plant coproduct supply. Coproduct propylene supply depends primarily on the use of propane, normal butane, naphtha, and other heavy feeds. In second-half 2020 monthly survey results showed demand for LPG feeds (propane, normal butane) averaged 338,000 b/d, with demand for heavy feeds at 120,000 b/d. Demand for LPG and all heavy feeds during the same period was 458,000 b/d, with LPG and heavy feeds accounting for 23.7% of all fresh feeds. In first-half 2020, LPG and heavy feed demand was 459,000 b/d, accounting for 21.6% of all fresh feeds. If hurricanes had not caused 60 days of downtime for Lake Charles ethane crackers, second-half 2020 coproduct propylene supply (19.2 million lb/day) would almost have equaled first-half 2020 supply (19.5 million lb/day).
Table 5 shows Petral Consulting’s estimates of coproduct propylene supply.
Refinery propylene sales into the merchant market are a function of:
- FCCU feed rates (most important variable)
- FCCU operating severity (important but not directly measurable)
- Economic incentive to sell propylene rather than use it as feed to alkylation units.
Seasonal variations in refinery operating rates directly influence FCC feed rates, and the combination of feed rates and operating severity are the most important factors determining variations in refinery-grade propylene supply. USGC and Midcontinent refineries account for 95% (or more) of refinery propylene supply for USGC propylene consumers.
The COVID-19 pandemic prompted US federal state and local governments to impose nationwide restrictions on public gatherings, as well as on international and domestic air travel. The cumulative impact these rules and restrictions most severely impacted refinery operations in second-quarter 2020. As people adjusted to these regulations, demand for gasoline and diesel fuel began rebounding in third-quarter 2020 before plateauing in the fourth quarter. All comparisons of crude runs and FCCU feed rates for second, third and fourth-quarters 2020 are relative to volumes in 2019.
After falling 2.3 million b/d (18.4%) below 2019 volumes in second-quarter 2020, combined crude runs at USGC and Midcontinent refineries were 10.97 million b/d in third-quarter 2020—down 2 million b/d (15.4%) from third-quarter 2019—and 10.90-10.95 million b/d in the fourth quarter—down 1.6 million b/d (12.9%) from fourth-quarter 2019.
USGC and Midcontinent FCCU feed rates were 3.24 million b/d in third-quarter 2020 and 3.20-3.30 million b/d in the fourth quarter, leaving second-half 2020 FCCU feed rates:
- 0.95 million b/d less than third-quarter 2019.
- 0.41 million b/d (11.2%) lower than third-quarter 2019.
- 0.30-0.35 million b/d (8.7%) below fourth-quarter 2019.
FCCU feed rates were 24.5% of crude runs in second-quarter 2020, 29.6% in the third quarter, and 30.6% in the fourth quarter.
These year-over-year comparisons for crude runs and FCCU feed rates are notable. While demand for all transportation fuels declined in second-quarter 2020, the year-over-year decline in demand for jet fuel was 62% in second-quarter 2020, 46% in the third quarter, and 42-45% in the fourth quarter. Second-quarter 2020 gasoline demand fell 27% below second-quarter 2019, 8% less in the third quarter, and 10-13% lower in the fourth quarter.
As demand for gasoline, diesel, and jet fuel vary independently, US refineries must adjust product slates to maintain market balances. During second-half 2020, US refineries reduced crude runs and diverted 50-60% of normal jet fuel production in FCCUs, resulting in FCCUs running at higher rates relative to refinery crude runs. A year-over-year comparison of gasoline production vs. crude runs shows refiners also ran FCCUs at higher severity. During third-quarter 2020, gasoline production and crude runs were down 11.9% and 15.4%, respectively, from the same period in 2019.
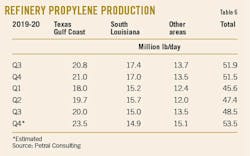
The year-over-year decline in refinery crude runs was the most important variable influencing refinery grade propylene sales in second-half 2020. USGC and Midcontinent supply of refinery grade propylene in second-quarter 2020 was 44.3 million lb/day, down 4.6 million lb/day (9.4%) from second-quarter 2019. As refiners adapted operations, refinery grade propylene supply increased in third-quarter 2020 to 45.1 million lb/day, down 3.2 million lb/day (6.7%) from third-quarter 2019. Based on US Energy Information Administration (EIA) monthly statistics for October and weekly statistics for November-December, refinery propylene supply in fourth-quarter 2020 was up 1.8 million lb/day (3.9%) from fourth-quarter 2019.
With hurricane activity in Louisiana curtailing refinery operating rates, September-October 2020 crude runs and FCCU feed rates were 35-40% and 30-35% lower, respectively, from the same months in 2019. The year-over-year decline in propylene supply from Louisiana refineries averaged 2.5-2.6 million lb/day in September-October 2020. Propylene supply from Texas refineries, however, rose 0.3 million lb/day in September 2020 and 1.2 million b/d in October vs. volumes supplied in September and October 2019.
Table 6 shows trends in geographic distribution of refinery propylene supply.
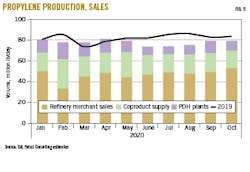
US supply. EIA statistics for refinery-grade propylene and Petral Consulting estimates for coproduct supply and propane dehydrogenation (PDH) plant production show USGC propylene supply in 2020 fell to its lowest levels of the year in June-July at 70.5-71.0 million lb/day. Despite hurricanes and reduced refinery operating rates in Louisiana, supply increased to 75.6 million lb/day in September 2020 but slipped to 73.7 million lb/day in October. While USGC propane dehydrogenation (PDH) plants underwent major downtime in June-August 2020, operating rates improved in September-October. Based on EIA weekly statistics and Petral Consulting estimates, supply from all sources in 2020 totaled 76-80 million lb/day.
Fig. 5 shows coproduct supply trends, PDH plant production, and refinery merchant sales of propylene.
Propylene economics, pricing
During second-half 2020, unleaded regular gasoline prices in the USGC pipeline market varied within a range of 110-120¢/gal (18.3-19.6¢/lb) until November before jumping to 130¢/gal (21.1¢/lb) in December. Using unleaded regular gasoline prices as the independent value basis, refinery-grade propylene prices averaged 16¢/lb during second-half 2020, according to OPIS PetroChem Wire reports. In third-quarter 2020, spot prices for refinery-grade propylene were at discounts of 3.1¢/lb to unleaded regular gasoline. Loss of coproduct supply from Lake Charles ethylene plants and reduced supply from Louisiana refineries had a modestly bullish impact on prices in October-November, lifting refinery propylene prices to parity with gasoline prices. In December 2020, however, refinery propylene prices spiked to 30.5¢/lb, or premiums of 9.3¢/lb above gasoline prices. By the time of publication, the circumstances that sparked the yearend 2020 price spike were undetermined.
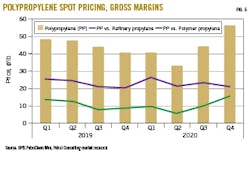
Two economic factors are the primary drivers for polymer-grade propylene prices. The cost of upgrading refinery propylene via propane-propylene fractionation units (commonly known as PP splitters) is a well-established driver. A few companies control merchant fractionation capacity for upgrading refinery propylene to polymer-grade quality. Based on 36 months of historical prices and pricing differentials, the usual pricing uplift to upgrade refinery propylene to polymer-grade propylene is 12-15¢/lb. Polymer-grade propylene premiums to refinery-grade propylene were 15-16¢/lb in first-half 2020 before increasing to 18-19¢/lb (+17.5%) in second-half 2020. As refinery propylene prices gained strength relative to unleaded regular gasoline in second-half 2020, bullish pressure on polymer-grade propylene prices also increased.
The conversion cost of propane to propylene via a dehydrogenation unit is another important price driver for polymer-grade propylene. Propane is a PDH plant’s major cost, and PDH plant process economics vary directly with propane prices. Petral Consulting monitors and forecasts prices for both grades.
As oil producers in the Middle East implemented deep cuts in crude production, gas-plant propane supply declined, and international market balances gradually tightened. Since propane consumption is concentrated in the northern hemisphere, colder weather boosted space-heating demand for propane, increasing bullish influences on prices.
In May 2020, prices for propane in storage at Mont Belvieu were 9.9¢/lb before rising to 11-12¢/lb in June-September. As colder weather boosted space-heating demand, propane exports jumped sharply, lifting prices to 13-15¢/lb in November-December. During second-quarter 2020, polymer-grade propylene premiums to propane rose to15¢/lb before improving to 18-23¢/lb in July-November and 28.6¢/lb in December.
Based on OPIS PetroChem Wire reports, spot prices for polymer-grade propylene averaged 34.3¢/lb in third-quarter 2020 and 41.1¢/lb in the fourth quarter, with contract prices settling within a range of 36-38.5¢/lb between August and November. During the first 2 days of December 2020, however, spot prices were 42-44¢/lb, before jumping to 51-52¢/lb by Dec. 11 and 54-55¢/lb by Christmas for a monthly average of 51.6¢/lb, up 14.4¢/lb (38.6%) from November.
The price jump likely resulted from a plant outage that forced a major producer to cover substantial volumes via the spot market. PetroChem Wire reports indicate one major olefins complex in South Texas shut down in mid-December 2020 after experiencing a serious maintenance problem. As of late-January 2020, about 70-75% of this same complex’s ethylene capacity remained out of service.
Fig. 6 shows trends in polypropylene differential pricing vs. spot pricing for refinery and polymer-grade propylene. Fig. 7 shows trends in polypropylene exports.
2021-22 outlook
The critical objective of USGC ethylene producers is to continue increasing exports of polyethylene, ethylene glycol, and other ethylene-based products to ROW destinations. Gross margins for HDPE (FOB Houston pricing) based on ethylene production costs from purity ethane improved consistently during second-half 2020, with the HDPE-ethane margin rising to 25.8¢/lb in the third quarter and 32.7¢/lb in the fourth quarter, reaching its strongest level since second-quarter 2018.
Continued growth in ethane supply for USGC ethylene producers is another critical parameter. As long as ethylene production costs based on purity ethane are consistently lower than costs based on light paraffinic naphtha, USGC ethylene producers will maintain economic advantages relative to producers in Europe and the Asia Pacific who rely on naphtha feedstocks.
Although hurricanes resulted in major downtime for Lake Charles ethylene plants during second-half 2020, ethane supply remained steady alongside a 300,000-b/d drop demand. In August-October 2020, ethane inventory in USGC reportable storage increased 24 million bbl to 46.1 million bbl on Aug. 1 before jumping to 70.0 million bbl on Nov. 1. Had ethylene producers in southwest Louisiana resold contract ethane into the spot market, ethane prices would have crashed. Gas-plant operating companies would have reduced ethane recovery by 200,000-300,000 b/d, and inventory would have remained steady. With the additional 24 million bbl of inventory, ethylene producers who depend on ethane exclusively increased their supply cushion by 25 days and improved their negotiating leverage.
By yearend 2020, OPEC also gave USGC ethylene producers an unexpected holiday surprise by amending its existing production curtailment agreement to adjust total production monthly and cap monthly output increases at a maximum of 500,000 b/d. Saudi Arabia additionally agreed to reduce its January 2021 allocation by 1 million b/d and granted other OPEC members an additional allocation of 250,000 b/d, prompting a 10% increase in oil prices during the first 5 trading days of the new year. If OPEC maintains strict adherence to the revised agreement, world oil markets will have a greater degree of confidence in a balanced market. A balanced oil market amid steady or stronger crude oil prices improves USGC producers’ cost advantage and prospects for resuming growth in exports of polyethylene and other derivatives.
The author
Daniel L. Lippe ([email protected]) is president of Petral Consulting Co., which he founded in 1988. He has expertise in economic analysis of a broad spectrum of petroleum products including crude oil and refined products, natural gas, natural gas liquids, other ethylene feedstocks, and primary petrochemicals.
Lippe began his professional career in 1974 with Diamond Shamrock Chemical Co., moved into professional consulting in 1979, and has served petroleum, midstream, and petrochemical industry clients since. He holds a BS (1974) in chemical engineering from Texas A&M University and an MBA (1981) from Houston Baptist University. He is an active member of the Gas Processors Suppliers Association.
