US & Russia in zero-sum LNG contest

A recent Baker Institute report, “US LNG Exports: Truth and Consequence Revisited,” raised several issues in the interest of highlighting what previous studies commissioned by the US Department of Energy (DOE) have found regarding US LNG exports.1
That report applied some basic international trade theory, options theory, and other economic principles to outline how markets have developed and where they may be going.
The evolution of the global LNG industry and the role US natural gas has played over the last 20 years has been nothing short of astounding, and the implications are still unfolding. Of course, any study of LNG is an exercise in international trade economics, and understanding how different scenarios might unfold is critical.
Such an approach requires looking forward rather than backward, which can be complex because outlooks are conditional on the assumptions made. When this is properly understood, scenario-based outlooks can be powerful tools for a deeper analysis of the risks and opportunities associated with various market dynamics.
The April 2025 ‘Scenarios for global natural gas markets to 2050’ report examines several scenarios to address the following questions:
- What are the implications of different levels of US LNG exports for the domestic and international markets?
- How important are oil market activities for US gas market balance, and what does this relationship mean for the future of US LNG exports?
- What are the implications of higher or lower natural gas demand—due to, for instance, significant expansion of demand for power generation or displacement of demand by new technologies, respectively—for US and global gas markets?
The answers to these questions have bearing on the value of US LNG exports. Among the report’s key findings were:
- Markets trigger responses on multiple margins. Understanding the multifaceted nature of market responses is paramount for commercial strategy and policy.
- Prices converge across Europe and Asia indicating that the global LNG market becomes increasingly fungible, which results in the elimination of longrun arbitrage opportunities between Europe and Asia.
- Altering the pace and scale of US LNG exports alters the profitability of competing projects. There is significant first-mover advantage in the global gas market, so if a project is delayed in one part of the world, a competing project elsewhere may look more favorable. All else equal, the delayed project would then wait even longer to find a new window to earn a suitable rate of return. This plays out across scenarios, especially between Russia and the US. US LNG exports are sensitive to changing market realities. Export authorizations are important, but they do not dictate outcomes; commercial and financial viability of the export project does.
- US LNG exports have implications for international market balance, and hence economic and energy security. The most heavily impacted exporting country across multiple scenarios is Russia, which has significant geopolitical and energy security implications. US LNG provides a real option for buyers in Europe and Asia to enhance supply portfolio diversification and energy security.
- Greater US LNG exports drive greater LNG imports in both Asia and Europe. Hence, US LNG exports carry environmental implications, particularly for coal-rich Asian economies. In a market in which value is placed on carbon reduction, natural gas is increasingly attractive relative to coal for dispatchable power generation. The absence of US LNG prevents this value from being fully realized.
- Canada plays a vital role for US gas market balance. The deep interconnection of these North American neighbors allows the natural gas resources in Canada to serve as a backstop for US supplies. This point is often overlooked in analysis of the impact of US LNG exports on domestic gas markets.
- All scenarios highlight the importance of unencumbered investment along supply chains. The ability for actors to respond quickly to different stimuli is central to fungibility. When constraints reduce access to resources, for example, prices are higher, and trade is reduced, which carries geopolitical implications. This is often framed in the context of permitting and access, but it is more generally apt in the context of minimizing policy uncertainty.
- New technologies that can substitute for natural gas will reduce demand, but cost matters. The implications for exporting regions and importing regions are different, as higher-priced importing regions should adopt the technology more aggressively, leading to price reductions along the natural gas supply chain all the way back to the wellhead and delaying adoption in exporting regions.
- Finally, scenario analysis allows evaluation of the simplest of changes to recognize the multiple margins of market response. The scenario analysis conducted in the report underlying this article highlights the option value of US LNG exports for macroeconomics, geopolitics, and the environment. Markets will ultimately determine the extent to which that value is present, if they are allowed to do so.
Background
Forecasting is an inexact science. This lesson has been made clear time and time again, which is why views to the future are often framed as scenarios. Scenario analysis allows one to construct a series of “what ifs” that can be useful for assessing risks and opportunities when the world theater changes the script. This means, unfortunately, that the number of scenarios can be limitless.
Moreover, they can range from relatively simple to immensely complex.
For example, economic growth, geopolitical shifts, global financial crises, pandemics, kinetic conflicts, trade wars, and a host of other issues are factors that cannot be perfectly predicted but ultimately impact outcomes for energy markets. Moreover, all these factors and more change continuously, sometimes independently, but other times codependently.
Due to the complex nature of scenario analysis, the way they are interpreted matters. The scenario-building exercise is valuable for assessing the potential impacts of various investment decisions, policy directions, and other factors on market outcomes. Sometimes multiple scenarios will highlight similar outcomes; sometimes they will highlight radically different outcomes; and other times the differences are marginal. In all cases, there is information in the insights generated, which is valuable when performing risk assessments.
As noted in "US LNG Exports: Truth and Consequence Revisited," despite all the different scenarios evaluated regarding US LNG exports across multiple different studies performed at different times using different models, one result was consistent: The net macroeconomic impacts of US LNG exports are positive.1
This follows because in a competitive market, trade only occurs if positive value is generated at each point in the supply chain. If positive value did not exist, capital would not be allocated to the activity. This has positive spillover effects for labor markets and regional incomes.
So, market-determined trade flows will generally reveal positive net gains from trade.
Other interesting results can be gleaned from previous analyses of US LNG exports, such as the implications of a larger than expected growth or expansion of the domestic gas-resource base as well as international market outcomes and, concomitantly, their geopolitical implications. In the interest of expanding on this literature by focusing on a specific set of questions, the report underlying this article presents a set of scenarios for the future of global gas markets that were generated using the Rice World Gas Trade Model (RWGTM). The questions are motivated by the recent report, "US LNG Exports: Truth and Consequence Revisited," with a focus on the following:
- Implications of different levels of US LNG exports for the domestic and international market.
- Importance of upstream crude oil activities for US gas market balance in relation to the future of US LNG exports.
- Implications for US and global gas markets of higher or lower natural gas demand, due to significant expansion of demand for power generation or displacement of demand by new technologies, respectively.
To explore these questions, six scenarios were considered:
- Reference Case
- High US LNG Exports
- Restricted US LNG Exports
- Low Associated Gas Production in the US
- High Global Demand for Natural Gas
- Global Natural Gas Demand Destruction
Each scenario was discussed, and the outcomes of each relative to the Reference Case presented. This approach was taken to provide directional guidance regarding what may happen if different scenarios occur.
As with any forward-looking exercise, there are assumptions about economic and population growth, energy policy and technology adoption, and the way energy intensity declines with economic growth, structural change, and efficiency improvement. Any of these can change as the future unfolds.
All caveats recognized, there are powerful lessons in the scenarios presented by the underlying report, and they connect with current debates about the economic prospects, geopolitical implications, and environmental impacts of global natural gas trade. Directionally, the outcomes are consistent with economic fundamentals, as well as past market realizations. So, there is a solid footing upon which to draw conclusions.
The report shares the results, scenario by scenario, through graphs and key findings and closes with a summary of findings and implications.
RWGTM
The RWGTM considers possible paths for natural gas investments, production, consumption, and prices incorporating various economic and policy variables along with existing and potential barriers and incentives for investment and trade. This allows an assessment of the effects of various factors on natural gas market evolution. The RWGTM also considers the impacts of variables that affect energy production, such as fiscal terms, debt and equity considerations, access to resources, fixed and operating costs, and technology.
For any scenario considered, the model generates detailed outputs for natural gas production, consumption, trade, and price, as well as investment along the natural gas value chain. By developing supplies, pipelines, and LNG delivery infrastructure, the RWGTM provides a framework—grounded in geologic data and economic theory—to examine the effects of different economic and political influences on the global natural gas market.
In sum, there are 1,447 supply nodes and 922 demand nodes distributed across 158 different regions at a national and subnational level in the RWGTM. Across the 1,447 supply nodes are representations of proved reserves, as well as unknown but assessed resources in the “growth to known” and “undiscovered” categories, which are consistent with the US Geologic Survey definitions used in resource assessments.2
The resources are also identified as shale, coal seam, and conventional gas to allow for a distinction across reservoir properties that dictate field decline, which is an important determinant of cash flow and return on investment.
In addition to the significant amounts of data that constitute the supply side of the RWGTM, a view of future demand is also required. This allows a national and subnational outlook to be developed for natural gas demand.
First, energy intensity is projected for different countries, with gross domestic product (GDP) projections based on the International Monetary Fund’s World Economic Outlook through 2029 and a conditional convergence model of economic growth for all years after.3
Then, energy is separated into electricity generation and direct uses. This allows for the share of each energy source in total primary energy to be estimated by incorporating stated goals for deployment of wind, solar, nuclear, hydro, and geothermal technologies. Crude oil, coal, and natural gas compete for the remaining share of total primary energy based on price. This is conditioned by the current energy mix in each country, which effectively captures the influence of existing supply chains and domestic resource availability.
While stated goals for the deployment of non-hydrocarbon technologies change over time, it is worth noting that the most significant determinants of future energy demand by country are projections of GDP and population. This, in turn, has an impact on the energy mix by directly determining the residual demand that hydrocarbon energy sources can capture.
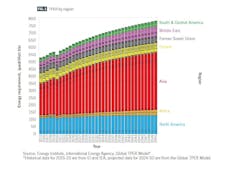
Total primary energy requirement (TPER) is a measure of the energy required to meet final consumption.
Fig. 1 shows TPER by region 2015-50.4 Regions are designated by color to easily identify tendencies. From top to bottom in Fig. 1, green indicates South and Central America; purple the Middle East; gray indicates the Former Soviet Union (FSU); yellow Europe; red indicates the Asia-Pacific region; orange Africa; and blue indicates North America. Each region is also subdivided by country or country grouping, as indicated in the key in Fig. 1.
It is important to note that for the RWGTM, demand by resource is separated into power generation and direct use. A high-level treatment for power generation is presented in this report, but that is where energy resources such as wind, solar, hydro, and nuclear are directly incorporated.
The most significant source of global energy demand growth through 2050 is projected to be the Asia-Pacific region. Growth in China is expected to taper, but the emergence of India’s growth offsets this effect.
For the Reference Case, global energy demand is expected to increase by about 33% from 2024 to 2050. North American demand is projected to increase 0.5%/year with the increase led by Mexico and demand in the US and Canada projected to be flat. Africa is projected to grow at 2.5%/year., the Asia-Pacific at 1.4%/year, Europe at 0.1%/year, FSU at 0.4%/year, the Middle East at 1.3%/year, and South and Central America at 1.2%/year.
In the Asia-Pacific, demand growth in China is projected to be below 1%/year. through 2050, but growth in India is expected to be close to 3.9%/year. So, there is significant variation across countries within regions.
Importantly, scale matters. A 1.4%/year growth in the Asia-Pacific region results in an increase in demand of just over 100 quads, while a 2.5%/year growth in Africa yields an increase in demand of almost 18 quads. So, while growth rates matter, the sheer scale of demand in the Asia-Pacific region renders it the most pronounced for energy market balance through 2050.
Energy demand declines in several countries—Japan, Belgium, Denmark, Estonia, Finland, Germany, Netherlands, Spain, and Russia—due to population decline, low longer-term GDP growth, and improvements in energy efficiency. Several other countries see energy demand growth that is below 0.5%/year due to a similar suite of factors: US, South Korea, almost all remaining European countries, Azerbaijan, Belarus, Turkmenistan, Iran, and Trinidad and Tobago.
The overall growth in energy demand globally through 2050 is driven by developing and emerging economies. As a result, any shifts in the development trajectories of these countries has significant implications for the future of energy demand, trade, and LNG market evolution.
The breakdown of global TPER by source reveals several interesting trends (Fig. 2).4 Fig. 2 is organized by color code according to the energy source across regions. From bottom to top, red indicates natural gas; gray indicates coal; green indicates crude oil; pink indicates nuclear; blue indicates hydro; purple indicates wind; yellow indicates solar; and brown indicates all other sources. The most obvious trend in Fig. 2 is the continued increase of wind and solar in total global market share through 2050.
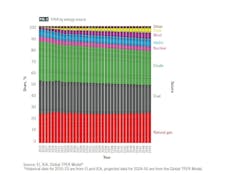
Global natural gas demand increases by about 45 quads, but it holds steady in terms of global market share at around 26%. The largest increases in natural gas demand are in the Asia-Pacific region and Africa. Despite global growth, some countries are expected to see declines in natural gas demand, especially in Europe.
Coal’s share of global energy declines from 27% to just under 24%. The decline would be greater if not for demand growth in developing Asia-Pacific economies.
Coal use declines in the US, Canada, Australia, Japan, South Korea, Taiwan, and all of Europe. China’s coal demand rises then falls from 2024 to 2050. Consequently, total global growth is fueled by other Asian economies, including India, where growth is around 2.5%/year from 2024 through 2050. The scale of coal demand in Asian economies, combined with relatively strong growth rates, drives an overall increase in coal use globally at a rate slightly more than 0.5%/year.
Crude oil’s share of global primary energy also declines, falling from around 32% to just under 29%. Demand falls in the US and Canada, driving an overall decline in North America, but it rises in Mexico through 2050. Crude oil demand rises at just more than 2.8%/ year in Africa, with growth seen in every country across the continent. Crude oil demand decreases in Australia, Japan, South Korea, and Taiwan. This demand is virtually unchanged from 2024 to 2050 in China, but strong growth in other Asian economies lifts overall demand in the region by almost 1%/year. Crude oil demand in Europe declines, but it is positive in South and Central America and the Middle East. In sum, global demand increases at an average rate of about 0.7%/year, driven entirely by developing economies, but crude oil’s share of total global energy declines.
Nuclear and hydro both expand through 2050, driven by Africa, the Asia-Pacific, and South and Central America.
The market share of nuclear in global energy remains relatively constant at just under 4%, and hydro’s market share increases to almost 7% from 6%. Notably, nuclear slightly declines in Europe and North America through 2050, while it increases in other regions. Hydro, on the other hand, either remains relatively unchanged or expands in every region.
Wind and solar expand their share of global primary energy, collectively, from 5.6% in 2023 to 10% in 2050, remaining the fastest growing energy sources globally, as has been the case for 25 years. Solar growth is generally stronger than wind, with expansion in some countries in Africa and the Middle East averaging more than 10%/year through 2050.
Scenarios
The new report’s scenarios include reference-case, high US LNG exports, restricted US LNG exports, low US associated-gas production, high global demand for natural gas, and global natural gas demand destruction.
These scenarios are designed to address the following questions:
- What are the implications of different levels of US LNG exports for the domestic and international markets?
- How important are oil market activities for US gas market balance, and what does that mean for the future of US LNG exports?
- What are the implications of higher and lower natural gas demand—perhaps due to significant expansion of demand for power generation or displacement of demand due to technological substitution, respectively—for US and global gas markets?
The scenarios reveal several interesting points. First, markets trigger responses on multiple margins. Regardless of the scenario considered, the responses in each case were multidimensional. Unfortunately, this means projections are complex when considering the dynamic responses in fungible markets where buyers and sellers seek to maximize the values of their portfolios.
However, this is not something to avoid; rather, complexity should be embraced to achieve a better understanding of market responses and the associated geopolitical and environmental implications.
A consistent pattern emerged in which US LNG exports compete directly with Russian LNG and pipeline exports for market share in Europe and Asia. Altering the pace and scale of US LNG exports alters the profitability of competing projects in other regions. There is significant first-mover advantage in the global gas market.
So, if a project is delayed in one part of the world, a competing project elsewhere may look more favorable. All else equal, the delayed project would then wait even longer to find a new window to earn a suitable rate of return. This dynamic feature of competition plays out across scenarios, especially between Russia and the US.
This, of course, has notable geopolitical and energy security implications. It also has large environmental implications, particularly because natural gas has the potential to displace coal in power generation, and coal is the dominant form of energy used in large developing Asian economies.
Given that higher US LNG exports drive greater LNG imports in both Asia and Europe, the value and flexibility that US supplies bring to the international market is directly apparent. If reducing carbon intensity is highly valued, then the attractiveness of switching to natural gas over coal for dispatchable power generation will be higher. Without US LNG, natural gas prices will remain higher in Asian markets, and the option to switch will remain unexercised.
That stated, it is also apparent from the scenarios that US LNG exports are sensitive to changing market realities. Market forces matter. A license to export does not guarantee export; the commercial viability of the project does. In all scenarios, the most competitive and commercially viable export projects move forward. Having an export authorization in hand is no guarantee that an export project will move forward.
The commercial and financial viability of the project matters, and market conditions will ultimately determine global demand for US LNG.
US LNG exports have implications for international market balance, and hence economic and energy security.
When US LNG exports are accelerated, they reduce market presence for competing suppliers. The most heavily impacted exporting country across multiple scenarios is Russia. When US LNG exports are greater, Russian exports are lower; when US LNG exports are lower, Russian exports are greater. Russian response occurs through both LNG and pipeline flows, as it has the advantage of being continentally connected to both Europe and China. But US LNG, when available, provides a real option for buyers in Europe and Asia to enhance supply portfolio diversification and energy security.
Canada plays a vital role in US gas market balance as a source of backstop supply. If a demand stimulus raises price in the US, Canadian production and exports via pipeline increase, which serves to mitigate the extent to which US prices rise. This point is often overlooked in analysis of how US LNG exports will impact domestic gas markets.
All scenarios highlight the importance of unencumbered investment along supply chains. The ability for actors to respond to different stimuli is central to fungibility. When constraints reduce access to resources, for example, prices are higher, and trade is reduced. This not only impacts markets, but it also carries geopolitical implications. This is often framed in the context of permitting and access, but it is more generally apt in the context of minimizing policy uncertainty.
Such dynamics have occurred previously in other markets, notably when economies awoke from pandemic-induced shutdowns, and uncertainty persisted about the near-term future of economic activity and the nature of potentially new supply chains.
Understanding this can inform approaches to relieve supply chain stresses, which invokes discussions in the upstream production arena related to permitting and access.
New technologies that can substitute for natural gas will reduce demand, but cost matters. But the implications for exporting regions and importing regions are quite different. Importing regions are, by definition, higher-priced markets; otherwise, they would not be importers.
For example, when a new technology is made available, importing countries, such as China and Europe, should be more willing to adopt it, even if the cost is prohibitive in lower-priced exporting regions, such as the US or the Middle East. In fact, exporting countries such as the US should be the last to adopt such technologies precisely because the cost is prohibitive relative to natural gas.
While one can posit that policy might force adoption of the new technology in the US, that still leaves an open question of why an importing country or region with higher natural gas prices would not more aggressively adopt a cost-competitive alternative.
A similar argument can be made regarding hydrogen in Europe. The simple fact that natural gas prices are higher in Europe than they are in the US means that hydrogen need not reach the same level of cost reductions to compete for legacy natural gas demand in Europe as it would in the US. This is a straightforward point that is often missed in broader discussions about energy choice.
The scenarios highlight the option value of US LNG exports, for macroeconomics, geopolitics, and the environment, and that markets will ultimately determine the extent to which that value is present, if allowed.
Editor’s note: The full Baker Institute report, with a breakdown of each scenario, can be found at https://www.bakerinstitute.org/sites/default/files/2025-03/20250320-Medlock-Scenarios%20for%20Global%20Natural%20Gas%20Markets%20to%202050-Report.pdf
References
- Medlock III, K.B., “US LNG Exports: Truth and Consequences Revisited,” Rice University’s Baker Institute for Public Policy, Feb. 17, 2025.
- Central Energy Resource Science Center, “United States Assessments of Undiscovered Oil and Gas Reserves,” US Geological Survey, Aug. 6, 2024.
- International Monetary Fund, “World Economic Outlook Databases, accessed Mar. 17, 2025.
- Energy Institute, “Statistical Review of World Energy,” 2024.