US LNG imports in 2008 signal unexpected role for gas markets
Recent experience and forecasts have shown a narrowing gap between domestic natural gas supply and consumption, unfavorable oil-to-gas price disconnects, increasing competition for limited liquefaction capacity, and dampened domestic demand due to the current economic decline. As a result, it seems likely that LNG’s role in meeting the US supply shortfall will be a supportive one in a highly competitive international gas market.
Given these market conditions, a merchant-based regasification strategy that depends on the availability of spot LNG cargoes is unlikely to be successful. Liquefaction capacity owners will retain a portion of the opportunity to capture geographic price differentials instead of selling it entirely to LNG marketers.
Such a role—and the associated costs of building expensive LNG delivery systems for other than base-load purposes—is unlikely to attract the levels of sustainable investment required for development of an extensive US LNG market.
Since 1959, when the Methane Pioneer demonstrated the feasibility of transporting LNG in a transoceanic trade, there have been two major waves of enthusiasm for projects to bring LNG from international sources into the US natural gas market.
First wave
The first occurred in the 1970s, a period of rising natural gas prices and nearly universal forecasts of even higher energy costs. Beginning in November 1971 with the first deliveries of LNG from Algeria’s Sonatrach to Distrigas at Everett, Mass., projects were developed over 1971-82 to deliver large volumes of LNG to terminals at Elba Island, Ga., Lake Charles, La., and Cove Point, Md.
These large, capital-intensive ventures involved the integrated construction of liquefaction and gasification facilities as well as fleets of expensive cryogenic tankers. Fig. 1 shows these projects delivered relatively modest volumes to the US market for several years, reaching peak delivery in 1979 of 253 bcf, which was 1.3% of US natural gas consumption that year.
As these projects were getting under way, however, federal regulatory initiatives began to change the fundamentals of the US natural gas industry. The Natural Gas Policy Act of 1979 was the first in a series of regulations that led to a broad restructuring of the US natural gas industry.1
These structural reforms precluded a utility’s ability to pass on the costs of more expensive contracted-for supplies when lower-cost supplies were available on the spot market and could be transported under the newly minted expedient of “open access.” With financial support for projects of that era typically long-term, take-or-pay arrangements, this evolution changed the US LNG industry.
Exacerbating the situation were contractual disputes over price with Algeria’s Sonatrach, the sole producer and supplier of LNG for these projects, and national security concerns about heavily relying on foreign suppliers of energy for US consumption. Although LNG’s peak year of supply saw imported natural gas from countries other than Canada or Mexico account for only 1.3% of US consumption, lengthy gasoline lines as the result the 1973 embargo and dislocations caused by the 1979 Iranian Revolution remained in the minds of American consumers and energy planners.
Owners at the Cove Point and Elba Island LNG terminals mothballed them in 1980, and the terminal at Lake Charles shut down shortly after its completion in 1982. By 1987, there were no deliveries of LNG to the US and only minimal deliveries throughout the 1990s.
Second wave
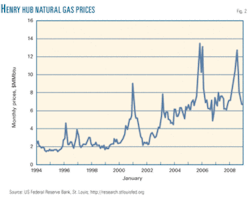
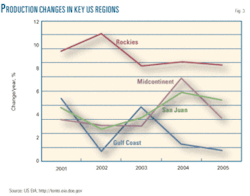
By the early 2000s, higher gas prices, declining domestic production, and expectations of slowing Canadian imports once again rekindled interest in bringing LNG to US markets. Figs. 2 and 3, respectively, present a spike in Henry Hub natural gas prices and deteriorating production profiles of major US production areas (with the exception of the Rockies).2
Accordingly, in 2003 the US Energy Information Administration forecast that by 2015, LNG would become the largest source of gas imported into the US, rising to 39% in 2010 from 5% of imports in 2002.3
That optimism reflected use of the four existing US terminals, three of which had been mothballed since the 1980s, as well as a flood of proposed regasification projects. By June 2004, there were 27 new regasification terminals in various stages of investor and governmental approval for a combined capacity of 31 bcfd,4 far more than expected demand.5
Recent experience
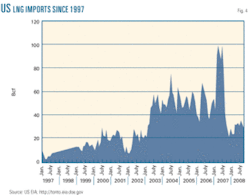
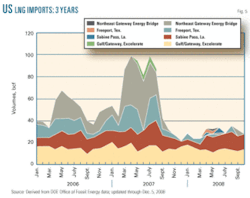
2007 was the peak year for LNG imports to the US with deliveries of 771 bcf, accounting for 16.7% of natural gas imports but still only a modest 3.3% of US natural gas consumption.6 In 2008, stronger demand for LNG in Europe and Asia diverted supplies from the US. Imports for the first 10 months of 2008 were only 298 bcf, about half of recent forecasts.
It may be argued that this downturn is cyclical in the development of a long-term LNG market and will be short. Several temporary and fundamental factors, however, emerged in 2008 to cause this bearish year for US LNG. Price, supply, and demand—while obviously linked—each experienced direct independent shocks that depressed US LNG imports in 2008. The future of US LNG rests with how persistent and powerful these dampening forces are in the face of significant new liquefaction capacity coming online and rising US natural gas demand.
Global gas pricing
The US competes with other importers, especially southern Europe and Japan,7 for LNG cargoes. Natural gas in these two markets is generally linked to oil prices, unlike in the US where natural gas prices are correlated to oil but through substitution and production effects vs. formula pricing. US natural gas prices are linked to prices at Henry Hub, the delivery point on the Louisiana Gulf Coast for natural gas futures contracts on the New York Mercantile Exchange. Henry Hub prices, although rising until recently, have generally been lower than prices linked to imported crude oil, as they are in Asia, or to other competing fuels, as they are in Europe.
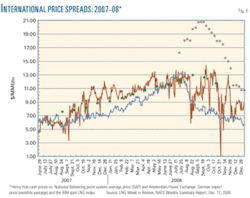
With the run-up in crude price—NYMEX prompt month crude futures hit an intraday high of $147.27/bbl on July, 11, 2008,8 oil and gas prices disconnected in 2008 (Fig. 6).
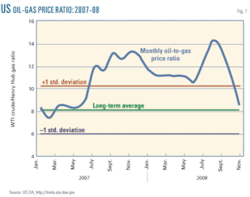
The historic relationship between a barrel of crude oil and an MMbtu of gas is 8.1.9 In 2008, however, it averaged 11.5. This disconnect, combined with the nature of international oil-based formula pricing, meant that natural gas prices were much higher in Europe and Japan than in the US.
The pricing environment was further stressed by a demand shock in Japan, the world’s largest LNG importer. In January 2008, a combination of cold weather and an extended nuclear-generation outage increased Japan’s need for replacement gas generation, driving LNG spot cargoes close to $20/MMbtu.10 These pricing dynamics explain why Cheniere Energy’s terminal at Sabine Pass, Tex., which has the largest US regasification capacity, did not receive a commercial delivery in 2008.
The collapse of crude prices in the last months of 2008 brought the oil-to-gas relationship back within normal ranges that, if sustained, will favor a more competitive domestic LNG market in 2009 (Fig. 7).
Supply
US LNG imports were further dampened in 2008 by two key elements:
- The near-term shortage of global liquefaction capacity.
- The rapid increase in domestic production largely related to unconventional gas production as an alternative to imported LNG.
Liquefaction capacity
Regasification capacity, which is less expensive and time consuming to construct than liquefaction capacity, has substantially outstripped the availability of new supply.10
Global liquefaction capacity has been slow to come online, with only a 1.9% increase during first-half 2008 compared to the same period in 2007. This slow growth is due both to delayed completion of in progress projects and cancellation of new projects.
There were significant project completion delays in 2008, including Tangguh, Sakhalin 2, Yemen LNG, Qatargas 2 Train 2, and RasGas 3 Train 1.11 Stretched vendor manufacturing capacity has led to longer delivery times. Governmental and lender requirements have become more onerous, extending the time for permitting and financing closure. And detailed engineering with less experienced personnel has also extended project timelines. Industry reports are that Qatar actually shut down some of its gas-to-liquids projects due to overextension of limited worldwide manufacturing and engineering capacity.
As for new projects, there are a few reasons for the slower entry of new LNG liquefaction projects. The first is the increased cost of capacity, from previous levels of about $200/metric ton to more than $600/metric ton in many cases. This reflects engineering, manufacturing, and construction costs that are higher than before. Secondly, oil companies have been cautious in making investments based on gas prices that might not be sustainable.
Finally, some projects that were being developed have stalled or been delayed due to government intervention; examples include Russia-Sakhalin (delayed), Iran-South Pars (canceled), Algeria-Arzew and Skikda (delayed), and Bolivia-Pacific (canceled).
In combination with previously mentioned pricing issues, this regasification-to-liquefaction capacity imbalance has left the US as the global swing market for excess LNG supply. This limitation will continue to be a bearish factor on the growth of US LNG imports.
Unconventional gas
While the gap between US and international gas prices was exacerbated by the historic disconnect between oil and gas prices, that was just one side of the equation. A spike in unconventional gas production increased US domestic production to a 20-year high of just more than 20 tcf.12
This increase in US domestic gas production was driven largely by rapid growth in unconventional gas production (shale gas, tight sands, and coalbed methane). Unconventional gas production–primarily shale plays–over the last couple of years has reversed a long-term trend of flat-to-declining production.
Unconventional gas production is not new; it has been around for decades. The combination of sustained higher gas prices, however, and breakthroughs in production technology has opened up vast new US natural gas reserves that are economically feasible to exploit.
Unconventional gas production comprised about 50% of US domestic production in 2008. Estimates of future unconventional gas production are invariably bullish but vary widely. Consensus estimates from leading forecasters expect shale production to grow at 10%/year through 2015, with all sources of unconventional gas accounting for about 65% of total US production.13
Most of this new supply, which was not anticipated during the flood of US regasification terminal projects in the mid 2000s, will displace once-planned LNG imports. Some forecasters have suggested that the unconventional base is substantial enough nearly to eliminate the need to bring LNG to the US through 2030.14
US LNG import full-cycle costs are about $3.50-4.50/MMbtu,15 16 while those for US shale production, depending on basin, are about $5.40-$7.50/MMbtu.17 While these full-cycle costs of importing LNG are less than for US domestic unconventional gas production, the substantial imbalance of global regasification to liquefaction capacity and international pricing dynamics addressed previously left the US in 2008 the market of last resort for spot LNG.
US gas demand
At the beginning of 2008, EIA projected that domestic consumption would rise year-over-year by more than 3%. But consumption increased at a fraction of that, by only 0.64%.
The National Bureau of Economic Research declared that the US has been in recession since December 2007.18 Over the last decade, the US economy has required about 500 MMbtu/$1 of gross domestic product. The recession has reduced demand, especially in many gas-intensive industries, including petrochemicals, fertilizer, steel, and other automobile-related industries. There have been a number of high-profile industrial plant closures in 2008, including, for example, that Chrysler would cease production at all its US plants for at least 1 month.19
EIA’s Short-Term Energy Outlook (Dec. 15, 2008) projected that natural gas consumption, which had been expected to grow by only 0.5% in 2008, will remain flat in 2009. Slight growth is expected in the residential, commercial, and electric-power sectors, but the worldwide economic downturn will result in a 2.4% decline in 2009’s consumption of natural gas by industry.20
Impact on investment
The import experience of 2008 and uncertain prospects for substantial near-term improvement left a wake of US LNG regasification causalities both large and small. Cheniere Energy, the best example of a US LNG pure play company, has seen its stock crushed and the enterprise forced onto life support with a distressed financing arrangement.
Other players experienced related challenges. Smaller project development players such as Quoddy Bay LNG21 and Calhoun LNG also felt the pinch, as the near-term fundamentals and credit crisis have limited interest from outside investors. BP cited LNG economic factors in its decision in late 2008 to postpone plans for its Crown Landing terminal along the Delaware River in New Jersey.
This situation has collapsed the business model pursued by some players, like Cheniere,22 that depended on the availability of spot cargoes both from a tolling and marketing fee standpoint. In contrast, more successful business models took the approach of matching long-term commitments to regasification capacity, such as Sempra’s 1-bcfd Energía Costa Azul terminal, which, in advance of construction, locked up commitments for 100% of its capacity via a mix of supply from Indonesia’s Tangguh and capacity payments from Shell.23 Other examples of this approach include the Freeport, Cove Point expansion, and Elba expansion projects. Regardless of the current business model employed, long-term viability of the US LNG industry depends on favorable natural gas pricing.
Future
The potential for projects currently planned or in their initial stages of operation is being revisited in light of conditions that manifested themselves in 2008 but may indicate longer-term structural changes in the US economy.
Accordingly, the longer-term future of US LNG rests with how persistent and powerful these dampening forces are in terms of prospects for significant new liquefaction capacity as well as for the resurgence of demand for natural gas demand that will result from economic recovery over the coming decades.
The question also arises whether the experience of 2008 was part of a developmental business cycle or did it indicate structural change in the price, supply, and demand relationships for LNG that will discourage future investment in the sector.
Having seen two disappointing waves of interest in the concept of importing LNG, investors (who are far from obliged to risk capital on energy ventures) may doubt whether the future role of LNG in the US supply mix is compatible with constructive investment.
References
- See, for example, FERC Orders No. 436 (1985), 500 (1987) and 636 (1992).
- Federal Reserve Bank of St. Louis., http://research.stlouisfed.org/fred2/series/gasprice.
- EIA, The Global Liquefied Natural Gas Market: Status & Outlook. December 2003, p. 29.
- EIA, “US LNG Markets and Uses: June 2004 Update,” pp. 7-8.
- In 2004, EIA’s Annual Energy Outlook forecast that LNG imports would grow to 2.2 tcf (6.0 bcfd) in 2010 and 4.8 tcf (13.2 bcfd) in 2025 from 0.2 tcf in 2002 (an average daily volume of 0.5 bcf).
- US Energy Information Administration.
- BP 2008 Statistical Energy Review, p. 30; www/bp.com.
- Reuters, “Oil hits record above $147,” July 11, 2008.
- 1994-2007 using WTI spot and Henry Hub spot monthly averages, as cited in http://tonto.eia.doe.gov; and http://research.stlouisfed.org.
- Platts, Global LNG Outlook, “LNG regas capacity is outstripping new liquefaction plant at a rapid rate,” Mar. 12, 2008; www.platts.com.
- FACTS Global Energy, Oct. 8, 2008; http://globallnginfo.com.
- EIA, US Natural Gas Marketed Production; http://tonto.eai.doe.gov.
- Wood Mackenzie’s Long-Term View, August 2008; www.woodmacresearch.com.
- Gas Daily, “Economists: Shale gas boom will cut need for LNG imports,” Dec. 8, 2008. Reporting on Rice World Gas Trade Model, presented by Hartley and Medlock at the US Association of Energy Economists conference in New Orleans, November 2008.
- Rice University World Gas Trade Model, Part 1, Presentation, May 26, 2004; www.riceinfo.rice.edu/energy/publications/docs/GSP_WorldGasTradeModel.
- Tristone Capital Presentation, Natural Gas and LNG Outlook, March 2008.
- Godec, Michael; Van Leeuwen, Tyler; and Kuuskraa, Vello A., “Rising drilling, stimulation costs pressure economics,” OGJ, Oct. 15, 2007, p. 45.
- National Bureau of Economic Research, “Determination of the December 2007 Peak in Economic Activity,” Dec. 11, 2008.
- CNN, “Chrysler shuts down all production,” Dec. 17, 2008.
- EIA, “Short Term Energy Outlook,” Dec. 15, 2008.
- Energy Current, “Quoddy Bay LNG requests additional delay,” July 24, 2008.
- While Cheniere has long-term fixed take-or-pay terminal-use agreements with Chevron and Total, the value of these agreements was spun off into a limited partnership: Cheniere Energy Partners LP.
- http://www.sempralng.com/Pages/Terminals/Energia/default.htm.
The authors
Robert Eric Borgstrom (reborgst @yahoo.com) is an independent consultant providing advisory services and training in energy regulatory policy and management. He has more than 30 years of management and international consulting experience with American Natural Resources and Columbia Gas as well as senior project-management positions with Bechtel, Price Waterhouse, and Stone & Webster. He was a resident project manager in India and Romania and served as the first director of regulatory economics for Tanzania’s multisector regulatory authority. Borgstrom holds a BA and an MA in geography from California State University at Northridge.
David Anthony Foti ([email protected]) is the head of commodity operations for a major global energy trading house. Over his more than 15 years in the energy industry, he was a market risk manager at Enron and has held strategy management consulting positions at Accenture, Deloitte, and Price Waterhouse. He holds FRM and PMP certifications. Foti holds a BBA in finance from the University of Texas at Austin and an MBA from the University of Houston.


