Australia emerging as top LNG supplier
Ronald D. Ripple
University of Tulsa
Tulsa, Okla.
AcknowledgementThis article draws from research conducted as part of the Harvard University-Rice University joint study on the Geopolitics of Natural Gas, 2014. |
Australia will be a key player in the global trade in natural gas for several decades, at least. This influence is based on projects already operating or under construction and does not rely on speculation regarding possible future project development.
All capacity currently under construction will be completed and operational before 2020 and perhaps as early as 2017. The three operating and seven under-construction LNG projects will propel Australia into the upper echelon of LNG exporting countries.
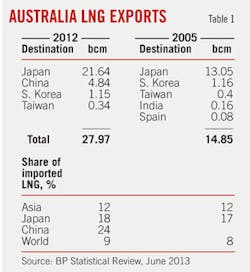
LNG trade grew 74% between 2005 and 2012, reaching 327.9 billion cu m/year (11.6 tcf/year or 243.1 million tonnes/year (tpy)),1 and will continue to grow well into the future. Australia will play a larger role in this growth than even the US (Table 1). Australia is Japan's largest supplier of natural gas, with Japan being the largest LNG importer in the world. Australia is also China's second largest LNG supplier.

Australia's exports of LNG increased 88% between 2005 and 2012.1 Australia has maintained its overall share of Asian LNG trade and increased its share of Japan's imports by 1%, during a period in which Japan's imports increased 56%. Since 2005 Kuwait, the UAE, China, India, Japan, South Korea, Taiwan, and the UK have all imported Australian LNG. Japan, however, has always been Australia's largest customer, typically exceeding 70% of its export volumes.
Australia's influence in natural gas trade will continue to be important. The country first entered the market to provide Japan an alternative source of gas, allowing it to diversify its energy supplies further. It is providing the proving grounds for LNG-export projects based on coalbed methane (CBM) (referred to as coalseam gas (CSG) in Australia) and for floating LNG (FLNG). Even with increased supply capacity, however, Australian natural gas exports are unlikely to place much downward pressure on prices because of the high-costs associated with building and operating liquefaction plants there.
Australia's role
Understanding Australia's role in the geopolitics and the geo-economics of natural gas begins with the internal, domestic geography and physical structure of the Australian natural gas market, and how these mesh with its role in international markets. Internally, the Australian natural gas market is split into the eastern, western, and northern segments, with no pipeline interconnections between these regions. Between 1989 and 2006, Western Australia (WA) was the only exporter of natural gas and also hosts most of the new capacity under construction.
Exports from Darwin, in the Northern Territory (NT), started in 2006 and will be augmented when the Ichthys project (fed from offshore WA) comes on stream at yearend 2016. Australian exports will extend further with completion of CSG-based export projects in Queensland starting next year (OGJ Online, Mar. 27, 2014).
By far the most natural gas in Australia (at least deriving from conventional geology) is found offshore WA. These resources are far from populated regions around Perth, which lies more than 1,500 km (about 932 miles) to the south. It also has been and remains uneconomic to pipe any of this gas across the empty center of the country to reach population centers in the East. The economics of natural gas in Australia, affected by its geography, therefore make exports the logical avenue for monetization of most of this resource.
The primary geopolitical relevance of Australia in natural gas trade is its role as an exporter to the large and growing East Asian markets. Australia imports small volumes of LNG from Timor Leste (East Timor), produced in the joint production zone supplying the Darwin LNG plant. Most of this gas is liquefied and shipped overseas. Australia has no pipeline connections with foreign producers and no LNG regasification terminals.
Current and future volumes represent supplies from a mature, politically stable democracy that provides a counterweight to reliance on Middle Eastern, Russian, and African sources. From a geo-economic standpoint, Australia is a stable source relatively close to East Asian markets.
Australia's engagement in LNG (as well as most of its other resources), particularly regarding Asia, is primarily driven by economics and little influenced by international politics. Nevertheless, Australia's current growth and potential to expand export capacity further into the region may have geopolitical implications, even between Australia and some of its closest allies.
If Australia is able to expand its export capacity further to Asia, at prices providing solid returns on investment with oil-based linkages or competitively against alternative suppliers in a delinked environment, it may slow Russian expansion into the Asia natural gas business. Australia's LNG projects have a reputation for reliability of supply, which to date is not the case with Russia.
And since the Australian government has never intervened or interfered with the supply of LNG to any country, there will be little concern about such potential in the future. This also cannot be said for Russia, and there could be concerns in Asia, especially from China, with respect to the reliability of US supplies.
Understanding Australia's role, and its potential, requires first understanding:
• The extent of its natural gas resource base.
• The location of its resources within Australia
• What the domestic demand for its resources is and will be.
• The level of investment in export capacity.
• Shipping distances to existing and potential markets; both absolute and relative to existing and potential competitors.
Resource base
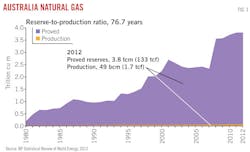
Fig. 1 makes clear the basis for Australia to play a major role in the global trade of natural gas. Production supports both domestic consumption and exports and amounted to 49 billion cu m in 2012 against proved reserves of 3.8 trillion cu m (134 tcf), implying a reserves-to-production (R/P) ratio of 76.7 years. In addition to domestic production, Australia's reported imports of natural gas from the offshore Joint Production Zone amounted to 10.9 billion cu m for 2012. The combined domestic production and imports supported domestic consumption and exports of slightly more than 51 billion cu m (1.8 tcf), divided roughly evenly between the two activities.
Location, infrastructure
The proved reserves estimates reported in Fig. 1 include CSG in the eastern states of Queensland and New South Wales but do not include estimates of other unconventional reserves, such as shale and tight gas. Indeed, much of the production increase reported in recent years has come from the conversion of CSG resources into proved reserves aimed at supporting the LNG plants under construction in Queensland.
Before this, reserves were declining as older conventional fields produced more than was replaced and reserve ownership between Australia and Timor Leste related to the offshore Joint Petroleum Development Area in the Timor Sea was reallocated. Domestic prices were too low to support new development. The conversion of known resources to proved reserves did not occur (and likely would not have occurred) until the prospect of accessing international markets and prices provided adequate economic incentive.
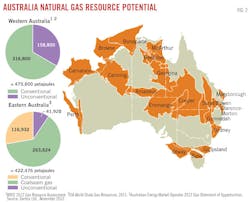
Most conventional proved reserves in Australia are north and northwest of Western Australia (Fig. 2). The Carnarvon basin is the source for the two operating LNG plants in Western Australia (North West Shelf project and Pluto), and it is the source for two other LNG projects under construction (Gorgon and Wheatstone). Chevron has reported 21 discoveries in the basin since 2009, with 10-tcf total recoverable resources.
In addition to the Carnarvon, the Browse and Bonaparte basins lie in the same region. Bonaparte straddles the WA and NT offshore regions, and Bayu-Undan field in the Joint Petroleum Development Area supplies the Darwin LNG plant.
The Ichthys project, also to be developed in Darwin, will obtain its natural gas feed from Ichthys field in the Browse basin, offshore WA, via an 850-km subsea pipeline. Nearly all of the conventional reserves in WA are offshore, some in relatively deep water, raising development costs accordingly.
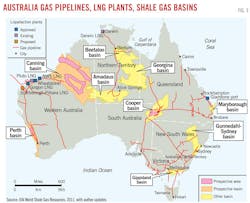
Figs. 2 and 3 illustrate where natural gas resources are within Australia and the limitations to their internal, domestic use. Canning, the largest shale gas basin, is in the far north of WA, again very far from consumption centers. The only shale gas production in Australia to date is from the Cooper basin and is integrated into the Eastern pipeline grid.
The 2013 US Energy Information Administration report on global shale gas resources shows Australia with the seventh largest potential shale gas resource at 437 tcf.2 No horizontal wells, however, have been drilled and completed. Australia still has only two rigs in the entire country capable of horizontal drilling and completion, with similar limitations on hydraulic fracturing.
Domestic use
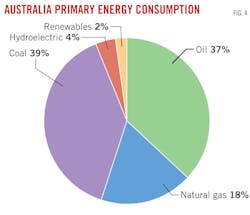
Natural gas represents 18% of the country's primary energy use, behind coal (39%) and oil (37%; Fig. 4). Total Australian domestic consumption for 2008-09 was 1.1 tcf, according to the country's Bureau of Resources and Energy Economics (BREE). BREE forecasts this will grow to 2.3 tcf by 2034-35.3 During the same period, however, it expects exports to increase to 5.1 tcf/year, dwarfing domestic use.
The potential growth in domestic consumption may be tempered by concerns over price. A large portion of the forecast growth is to come in electricity generation, but recent indications are that power generators are planning to substitute coal-fired generation for gas-fired due to price differentials.
To some extent this may be due to expectations that the price on carbon dioxide emissions will be removed—lowering expected coal-use costs at the same time natural gas prices increase due to larger exports—and the planned emissions trading system scrapped. The Labor-party government instituted a $23/tonne CO2 price in July 2012 but has since been replaced by a Liberal-National Coalition government that made removal of the carbon price a central election theme.
Export capacity, cost
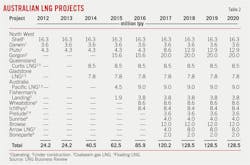
Australia has 24.2 million tpy of operating LNG production capacity and another 61.5 million tpy under construction and expected to be operational by 2017 (Table 2). These projects made up 64.5% of global capacity under construction at the start of 2013.4 The seven new LNG projects will add to the three existing plants to propel Australia's export capacity beyond Qatar's current 77 million tpy.
While it is unlikely that all schedules will be met to make this happen by 2017, there is no indication that any of the currently under-construction projects is under threat of termination or down-sizing. Some previously planned further expansions, however, have been placed on hold in the face of rising costs, including Gorgon's fourth train.
The simultaneous development of seven relatively remote major LNG projects, along with numerous other major resource project developments, has strained the Australian economy and resulted in high costs. In addition to the $190 billion of LNG projects under construction, more than $200 billion of work is under way in other Australian minerals sectors.5
Chevron expects the 15.6-million tpy Gorgon project to cost US$54 billion, increased from an initial estimate of $37 billion, implying a unit cost of $3,500/ tonne/year capacity. Inpex has budgeted $34 billion for Ichthys (OGJ Online, Jan. 13, 2012), or more than $4,400/tonne capacity. While these costs are now the norm in Australia, the global average is closer to $1,000/tonne. Woodside Energy Ltd. cancelled the proposed onshore Browse liquefaction plant in WA due to costs and is considering an FLNG alternative to monetize the offshore reserves (OGJ Online, Aug. 21, 2013).
Shipping advantage
The Australian natural gas sector's high costs, however, are somewhat offset by favorable shipping distances relative to most competitors. Table 3 provides selected shipping distances and cost estimates for comparison. Shipping distances between Australian projects and ports and destination markets in Asia are considerably shorter than those for Qatar.
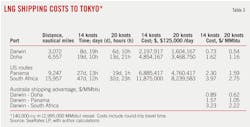
The shipping distance between Qatar and Tokyo is 6,557 nautical miles (nm), which at a speed of 14 knots requires 19 days 10 hr to transit. For Australia, Darwin is the closest, with Dampier (home to the North West Shelf and Pluto projects in WA) and Gladstone (home to the CSG-based projects in Queensland) effectively equidistant from Tokyo. The Darwin shipping distance is 3,072 nm, requiring 8 days 19 hr en route, while the Dampier and Gladstone distance is 3,742 nm, requiring 11 days 3 hr at the same 14 knots.6
Darwin has a roughly $0.89/MMbtu shipping advantage over Qatar. This estimate is based on day rates of $125,000 for a 140,000-cu m LNG tanker (roughly 3 MMbtu) and the 11-day shorter travel time each way.
Australia also has a considerable distance advantage over potential US Gulf Coast shipments. Routed through Panama, the distance from Houston to Tokyo is 9,247 nm, requiring 27 days 13 hr, while travelling around South Africa makes it 15,957 nm, requiring 47 days 12 hr. At 14 knots, Darwin has a $1.57/MMbtu advantage over the Panama route and $3.23/MMbtu advantage over US shipments sailing around South Africa.
US LNG
The possibility of the US becoming a significant natural gas exporter has potential market implications for natural gas around the world. How much gas will be exported and its effect on current prices and pricing mechanisms are primary questions.
Neither Australia's production nor the potential volumes from the US are entering a static marketplace. Demand for natural gas in Asia has been rising steeply, and this is expected to continue. BP's Energy Outlook 2035 projects an increase in total Asia Pacific natural gas consumption—including supplies from domestic production, LNG imports, and pipeline imports—of 21.5% by 2015, 51.7% by 2020, and 74.4% by 2025 from a 2012 base. BP also projects that Asia Pacific production will increase by only 14.0%, 44.4%, and 53.1% to 2015, 2020, and 2025, respectively, on the 2012 base.
BP's consumption projections for Asia Pacific assume that about half of Japan's currently shut nuclear power plants return to service by 2015, with reliance on nuclear declining as plants are retired with no extraordinary lifetime extensions. If instead Japan returned to previous nuclear power levels and expansion plans, natural gas demand would depend on how its share of electricity generation relative to oil and coal evolves. But Japan's commitment to CO2 emissions reductions would continue to give natural gas imports an edge over oil and coal.
Australia's increased export volumes and any volumes from the US will enter a rapidly growing market in which regional production will not keep pace with consumption. The total Asia Pacific consumption-production gap in 2012 equaled 99.8 million tonnes, the shortfall that must be imported, primarily as LNG. Table 4 shows this shortfall expanding to 148.5 million tonnes in 2015 and 177.7 million tonnes in 2020.
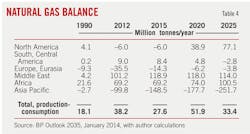
Total incremental LNG capacity under construction at the beginning of 2013 was 95.3 million tpy, including the 61.5 million tpy from Australia and 9.0 million tpy from Cheniere's Sabine Pass project in the US, implying a remaining consumption-production gap of 82.4 million tpy by 2020.
Even if some of the proposed US LNG export projects (not all of which are aimed at Asia) end up being approved by the US Federal Energy Regulatory Commission in time to be exporting by then, there would still be a sizable supply gap to be filled in the Asia Pacific alone.
Table 4 also shows global production expected to exceed consumption by 27.6, 51.9, and 33.4 million tpy for 2015, 2020, and 2025, respectively. These apparent excess supplies actually amount to only about 1% of global consumption in 2015 and 2025, and about 1.7% in 2020. This does not suggest a cushion large enough to place downward pressure on global prices, and much of the "excess" will require long-distance shipping to reach Asian markets.
This narrow gap should be encouraging from both the Australian and the US perspectives. While there will be competition from other regions, there is greater benefit expected to accrue from entering a rapidly growing market than entering a static one. Entering a static market, especially with large volumes, portends a decrease in price and attendant shrinking of margins.
The incentive to convert North American natural gas into LNG for transport to Asian markets is based on the current large price differentials. Given shipping distances, even with an expanded Panama Canal, it will not take a huge drop in the Asian price, or rise in the US price, to marginalize new US LNG shipments. Transit fees for the expanded Panama Canal could also increase, leaving Australia in an even better position for the future.
References
1. BP Statistical Review of World Energy, June 2013 (with author calculations).
2. "Technically Recoverable Shale Oil and Shale Gas Resources: An Assessment of 137 Shale Formations in 41 Countries Outside the United States," US Energy Information Administration/Advanced Resources International, June 10, 2013.
3. "Australian Energy Projections to 2034-2035," Australia Bureau of Resources and Energy Economics, December 2011.
4. LNG Business Review, several editions.
5. Resources and Energy Major Projects, Australia Bureau of Resources and Energy Economics, www.bree.gov.au.
6. SeaRates LP, www.searates.com.
The author

Ronald D. Ripple ([email protected]) is professor of energy business and finance University of Tulsa, Oklahoma. He previously served as director of the Centre for Research in Energy and Minerals Economics at Curtin University, Perth, Australia. He started his career as an economist in the Office of Budget and Management, Governor of Alaska. Ripple earned a BS in business administration (1975) from Pennsylvania State University, State College, Pa., an MA in economics (1980), also from Penn State, and a PhD in economics (1988) from University of Oregon, Eugene, Ore.