Oil industry holds recovery prospects in 2017
Conglin Xu
Senior Editor-Economics
Laura Bell
Statistics Editor
On Nov. 30, 2016, the Organization of Petroleum Exporting Countries agreed to cut 1.2 million b/d from global oil production. Non-OPEC producers, notably Russia, also have agreed to cut 558,000 b/d, representing the largest non-OPEC contribution ever to be agreed upon.
With the proposed production cut, OPEC, Russia, and other producers are looking to speed up the rebalancing of the global oil market. The agreements have been received positively as the price of Brent crude oil has risen sharply following the announcements.
Although the cut depends on implementation and compliance, the action is supportive of crude oil prices as industry heads into 2017. The oil market will likely swing from surplus to deficit in the first half of 2017 in the wake of the OPEC and non-OPEC output cuts.
With rapidly shrinking costs of production, US shale oil producers will especially benefit from higher prices. It remains to be seen how quickly and to what extent US shale oil drillers might respond by resuming more drilling. OPEC's willingness to underwrite higher prices and for how long, while losing share to the US, will be a question.
Meanwhile, as the proposed cut is for 6 months, high-cost producers might not take higher prices for granted and would be cautious at sanctioning new investments.
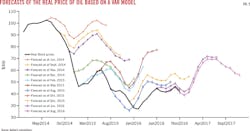
Interestingly, the results by a vector auto regression (VAR) model suggest that, even without the agreement among producers, crude oil prices would still be able to recover gradually in the first half of 2017. If the model-based forecasts were true, one would reevaluate the short-run and long-run impacts of the agreement.
As the price tailwinds over the past years is likely to wane this year, global oil demand is to revert to structural verities. Emerging markets in the Asia-Pacific region continue to be the engine of demand with the expansion of manufacturing, urbanization, and rising incomes.
Meanwhile, the fact that inventories are close to record highs will have a dampening effect on the rebalancing of the market. Massive crude oil and refined product inventories may take time to go down even when demand exceeds supply.
For the whole year 2016, US natural gas inventories were 6% more than their 5-year average. However, the overall supply-demand balance of the US gas market is tightening. Demand for US gas is receiving a boost from a forthcoming colder winter, rising US gas exports, and strong demand from the power generation sector. Although annual production in 2015 rose despite lower gas prices, monthly US gas production has since declined in 2016.
World economy, oil demand
Global economic growth is forecast to accelerate this year, largely driven by improvements in the US and parts of emerging economies. Commodity price recovery will stabilize the economies of resource-exporting countries that have been suffering over the past few years.
The International Monetary Fund's forecasts for economic growth are 3.1% for 2016 and 3.4% for 2017 compared with an estimated 3.2% for 2015. The World Bank revised its 2016 global economic growth forecast down to 2.4% in June from the 2.9% projected in January. Global growth is projected to pick up to 2.8% by 2017.
According to the IMF, the Organization for Economic Cooperation and Development's (OECD) growth rate for 2017 is forecast at 1.8% compared with 1.6% in 2016 and 2.1% in 2015. Non-OECD growth is forecast at 4.6% for 2017 compared with 4.2% in 2016 and 4% in 2015.
Downside risks, however, have become more pronounced. These include low interest rates after the 2008 recession, which has spurred rising asset prices, rising debts, and rising vulnerability to a sharp global financial tightening. Consumption and investment in advanced economies are softer-than-expected. World trade growth is exceptionally low. China's slowdown has been faster-than-anticipated. Exchange rate uncertainties and capital flow risks have increased in emerging market economies. Fiscal initiatives have been called on in many countries to encourage growth and job creation. However, long-run structural reforms are still difficult to carry out. The influence of unfavorable demographics is unlikely to be reversed soon. Policy and geopolitical uncertainties have been heightened globally.
In this context, global oil demand is expected to revert to structural verities, including fuel efficiency gains, economic growth, urbanization and industrialization trends, and population growth in emerging economies.
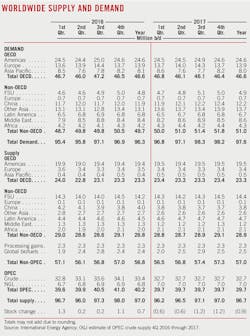
According to the International Energy Agency's December Oil Market Report, global oil demand growth is forecast to ease to 1.4 million b/d in 2016 and 1.3 million b/d in 2017, having peaked at a 5-year high of 1.8 million b/d in 2015.
According to IEA figures, non-OECD demand will rise 2.6% in 2017, led by other areas in Asia excluding China. Chinese oil demand in 2017 will increase modestly to 12.2 million b/d from 11.9 million b/d last year, IEA forecasts. This represents a growth slowdown to 2.5% from 2.9%.
Non-OECD and non-Asia demand, heavily comprised of oil and commodity exporters, including the Middle East and Africa, should benefit from improving oil prices.
OECD demand growth will be largely flat in 2017, due to low intensity of use, rising fuel efficiency, and an overall sluggish economy. Demand growth will vary across regions. The most recently reported IEA demand figures revealed modestly growing US demand, flattish OECD European demand, and contracting OECD Pacific demand.
By comparison the US Energy Information Administration expected a higher 2017 demand growth of 1.6 million b/d, up from 1.4 million b/d in 2016, as most recent global economic data have been more positive than previous expectations.
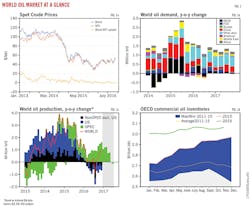
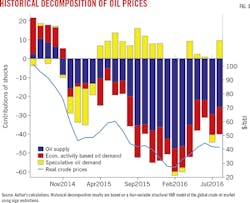
In addition, a historical decomposition analysis of OGJ shows that speculative oil demand rebounded during 2015 (Fig. 3). This might reflect increased stockpiling in oil-importing countries to take advantage of low oil prices. However, such speculative oil demand is retreating as oil prices rise.
World oil supply, OECD inventories
OPEC agreed to cut output by 1.2 million b/d from January 2017. OPEC supply targets, set for the first time since 2008, leave Saudi Arabia bearing the brunt of the cut. Nigeria and Libya are exempt, Iran got a slight increase, and Iraq was allocated a cut of 210,000 b/d.
The organization secured a reduction of 558,000 b/d from non-OPEC producers. In addition to Russia-which had already committed to curb production by 300,000 b/d over first-half 2017-Azerbaijan, Bahrain, Brunei, Equatorial Guinea, Kazakhstan, Malaysia, Mexico, Oman, Sudan, and South Sudan also agreed to reduce output. Notably, Mexico's oil production is already set to fall due to natural declines.
Following a period of growth in 2013-15, total non-OPEC liquids production contracted by nearly 900,000 b/d year-over-year in 2016. The main contributors to the decline were the US, China, Mexico, Colombia, and other OECD Europe. Production in Russia, Brazil, Congo, and the UK continued to rise last year.
With the production cut factored in, non-OPEC supply for 2017 is still anticipated to rise 200,000 b/d, according to IEA's latest Oil Market Report.
A price recovery above $50/bbl could contribute to supply growth in the US and in other non-OPEC producing countries not participating in the supply reductions.
Increased activity in the US is already under way, particularly in the Permian basin. Rystad Energy analysis shows that as much as $15 billion in increased spending will flow into the non-OPEC shale market in 2017.
Production from Brazil, Canada, Ghana, and Congo will continue to rise this year with new projects ramping up. Chinese production will continue to decline, following a fall of 335,000 b/d last year, as no uptick in activity expected from the major companies.
According to IEA data, taken together, OECD stocks have lost 74.5 million bbl since reaching a historical record of 3,102 million bbl in the July, but they remain 300 million bbl above the 5-year average.
Preliminary data show a fourth monthly draw in oil stocks in the OECD last November, marking the longest stretch of draws seen since 2011.
Combined with projected demand and production for the first half of the year, inventory draws are expected. However, given the magnitude of the current inventory overhang, a 6-month agreement is unlikely to prove sufficient in resetting OECD inventories back to more normalized levels.
A VAR model analysis
Since oil prices are notoriously difficult to predict, practitioners have long relied on futures. However, recently developed economic vector auto-regression (VAR) models (Kilian and Baumeister, 2009, 2010) have been used for short to medium-term real oil price forecasting. The literature of the past few years has shown that these real oil price forecasts provide more accurate predictions of the future path of real oil prices relative to futures or other models.
According to an analysis calculated by the OGJ staff, the VAR model forecasts display consistently high directional accuracy throughout the evaluation period from June 2014 to August 2016. Interestingly, the model forecasts gradual recovery in real oil prices starting from early 2017. Since the forecast is based on a dataset until August and doesn't factor in the production cut, it suggests that crude oil prices will recover on itself even without the agreement among producers.
If the model-based forecasts were true, one would rethink the short-run and long-run impacts of the agreement.
US economy, energy use
US economic growth is set to strengthen in 2017. OGJ forecasts that the US economy, measured by real gross domestic product, will expand at a rate of 2.2% this year. Although real GDP growth of 2016 was estimated at 1.5%, economic activity has been expanding at a moderate pace since mid-2016.
Employment also has risen steadily. According to the latest report from the Bureau of Labor Statistics, an estimated 178,000 jobs were added to the economy. The unemployment rate decreased by 0.3 of a percentage point, and the total number of unemployed persons declined 387,000 to 7.4 million.
Increased employment and wages will further support growth, offsetting somewhat sluggish external demand. Additionally, a more expansionary fiscal stance is expected for the new administration, as public spending and investment rise, while taxes are cut.
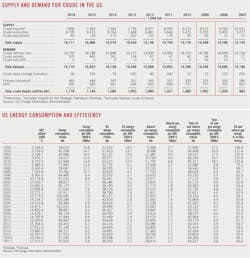
Energy use in the US contracted 0.3% in 2016, according to EIA data, but is expected to increase in 2017, boosted by expanding economic activities. It is worth noting that EIA data on energy consumption is subject to frequent revisions, which might affect related analysis.
Oil demand this year will rise 0.3%, following a growth of 0.6% last year. The impact of earlier sharp price falls between 2014 and early 2016 on gasoline consumption may start to fade this year. Oil will remain the dominant energy source in the US, holding 36.7% of the market.
Gas consumption is predicted to increase 0.1% this year compared with a 0.8% increase last year. The gas market share will stand at 29.1% this year compared with 29.3% in 2016 and 29% in 2015.
Gas generated about 34% of the country's total electricity in 2016, up from 32.7% in 2015. The estimated share of coal-fired electricity generation was 30.5% last year. Last year was the first year that gas-fired electricity generation exceeded that fired by coal. In 2017, coal consumption is estimated to increase due to rising gas rates.
US oil demand
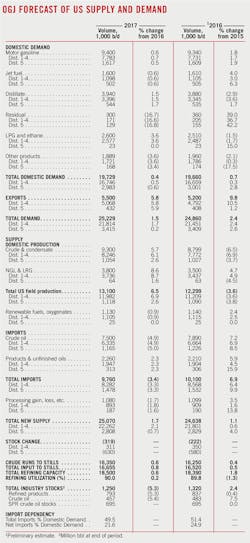
OGJ forecasts US demand for motor gasoline to average 9.4 million b/d in 2017, a 0.6% increase from the 2016 level. This is down from a 1.8% year-over-year increase seen in 2016. The regular gasoline retail price is projected to average $2.30/gal in 2017, up from $2.14/gal in 2016, according to EIA's December Short-Term Energy Outlook.
Demand for distillate, which is used mostly as heating oil and transportation fuel, decreased 2.9% last year to an average of 3.88 million b/d, reflecting a warmer-than-normal first quarter in 2016, sluggish growth in first-half 2016, and reduced transportation in the oil and gas sector. This year, as drilling activities recover, economic growth accelerates, and winter might be colder, distillate consumption is expected to increase.
Jet fuel price is forecast to increase to $1.64/gal from $1.33/gal last year, EIA said. Jet fuel demand will decrease slightly from last year's high.
Residual fuel consumption increased 39% last year, driven by recent expansion of tanker fleets, increased long-distance trade, and lower Russian residual fuel exports. Going forward, tanker rates should recover as the global market slowly returns to balance.
US oil production
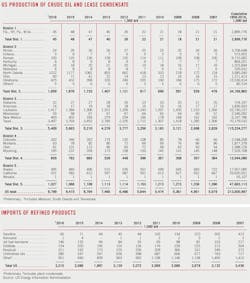
As a result of lower oil prices, US crude and condensate production decreased 6.5% to 8.8 million b/d in 2016. OGJ expects a robust US oil production response to higher oil prices in 2017. US crude oil production is forecast to average 9.3 million b/d this year, up 5.7% from 2016. The forecast is based on an estimated WTI average of $55/bbl for 2017 compared with $43/bbl in 2016.
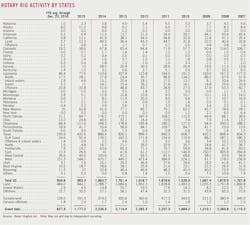
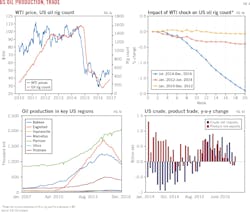
Activity in the US shale patch is already increasing. US producers have put 207 rigs back in service since hitting a low of 316 oil rigs in May. The majority of the rigs were added to the Permian basin.
According to a OGJ analysis, US oil rig count response to WTI changes has been four times more sensitive since the price fall (Fig 4b).
During second-half 2016, the Lower 48 rig count has expanded from 7 rigs/week in the third quarter to 10 rigs/week in the fourth quarter. In December, an expansion speed of 21 rigs/week was reached.
In recent financial filings, a number of US independent companies revised upwards their 2016 capital expenditure guidance while suggesting further increases in spending and activity in 2017, especially in the Permian basin. At the same time, these companies emphasize spending within or near cash flow in their business plans.
Befitting from the improved price environment, less asset impairments, and enhanced cost efficiency, the US shale industry is now closer to being able to fund capital spending programs within operational cash flows. During the third quarter, for the first time, the sector reached free cash flow neutrality. However, upward pressure on costs will reappear once the industry scales up activity, posting new challenges to US oil producers.
The Gulf of Mexico is expected to see continued crude production growth in 2017, following a 7% increase last year, primarily driven by new projects coming online.
US natural gas liquids production will increase 8% to 3.5 million b/d this year, OGJ forecasts.
Inventories
Industry stocks of crude ended last year at an estimated 483 million bbl, up from 449 million bbl a year earlier. At the end of 2016, the Strategic Petroleum Reserve held 695 million bbl, unchanged from a year ago.
Preliminary data from EIA suggest that US crude stockpiles continued to build through to mid-November, before drawing on the back of higher demand from refineries and lower imports.
The US Department of Energy's Office of Fossil Energy recently announced that it will sell crude oil from the SPR as early as January. The announcement came after a Continuing Resolution that included a provision for DOE to sell up to $375.4 million in crude oil from the SPR was enacted into law earlier in December 2016. This sale is the first of several planned sales totaling nearly 190 million bbl during fiscal years 2017 through 2025.
Latest EIA data show that, as US refineries ramped up output seasonally in November, oil product stocks gained, especially for gasoline and distillate stocks. Seasonal increase in demand and strong exports led to a further decline in propane stocks. Jet fuel stocks were 3.1 million bbl above year-ago levels at end-November due to higher imports.
Imports, exports
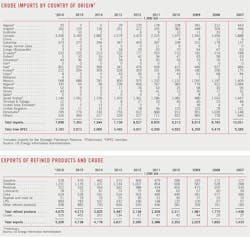
Lower US crude production and high demand to build crude inventories led to higher crude imports in 2016. The narrowing price differentials between US crude and international benchmarks led to increased imports in refining areas where imported crude had a delivered cost advantage relative to similar US crude.
During 2016, the US imported 7.89 million b/d of crude, up 7.2% from the volumes imported in 2015. This increase reversed a multiyear decrease in crude oil imports as a result of increasing production. Although US crude exports increased by 60,000 b/d to 525,000 b/d in 2016, net imports of crude oil increased 7% year over year, marking the first increase since 2010.
Imports from OPEC members rose 510,000 b/d, or 19%, from a year ago. Imports from Iraq increased by 172,000 b/d, contributing to most of the imports increase in Gulf Coast. Imports from Nigeria increased 138,000 b/d, thanks to its increasing competitiveness for seaborne light sweet crude into East Coast.
Imports from non-OPEC countries increased less than 20,000 b/d. Imports from Mexico fell 120,000 b/d, offsetting the increase in imports from Canada and Colombia. Despite wildfires in Alberta that disrupted production in second-quarter 2016, Canada remained the top crude oil exporter to the US. Canadian heavy crude is particularly well suited for US refiners in the Midwest and Gulf Coast.
In 2016, led by residual fuel, US imports of refined products increased 5.9% from a year ago to 2.2 million b/d. In 2016, US exported 4.67 million b/d of petroleum products-almost 10 times the crude oil export volume-an increase of 402,000 b/d over 2015. Mexico, Canada, and the Netherlands received the greatest volumes of US petroleum products in 2016.
While US exports of distillate and gasoline increased by 55,000 b/d and 102,000 b/d, respectively, LPG exports increased by 110,000 b/d. Propane is now the second-largest US petroleum product export, surpassing motor gasoline.
Refining
Higher product demand in 2015 in reaction to lower crude prices led to higher margins, rising refining capacity, and higher utilization. However, this trend has begun to reverse in 2016 as increased products inventories have outpaced demand growth, leading to lower margins and reduced utilization. In 2017, refiners will face challenges coming from weak crack spreads, and higher costs for Renewable Identification Numbers (RIN).
Refining cash margins for the 2016 averaged $11.21/bbl for the Midwest, $14.36/bbl for the West Coast, $9.28/bbl for the Gulf Coast, and $3.74/bbl for the East Coast, according to Muse Stancil & Co. The average cash refining margins for these refining centers averaged a respective $17.58/bbl, $22.42/bbl, $11.27/bbl, and $5.52/bbl in 2015.
US refiners ran at lower utilization rates of 89.8% in 2016 compared with 91% in 2015. Refining capacity of 2016 increased 1.8% to 18.4 million bbl from a year ago.
As demand growth starts to slow down and gasoline and distillate inventories remain high, a flat utilization rate is expected this year.
Meantime, if the border tax of the administration of newly elected US President Donald J. Trump were to be implemented, the crude purchasing economics would change, according to Simmons & Co. Refiners with flexibility to shift from imports to domestic barrels would be advantaged, while domestic refiners with heavy exposure to imported crude could be most negatively impacted.
Natural gas
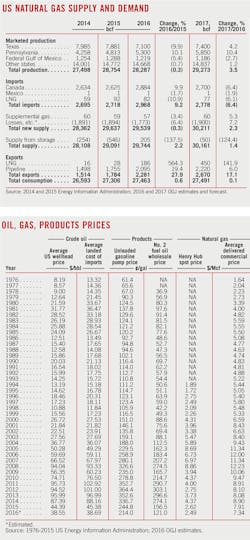
US natural gas consumption increased 0.6% in 2016 to 75.22 bcf/d, according to latest EIA data. The largest increase in consumption last year was in the electric power sector due to power plant improvements and lower gas prices. Combined consumption in the commercial and residential sectors declined 5% due to warm winter in the first quarter of 2016. Industrial consumption of the year increased 2%.
Consumption will grow 0.1% this year, OGJ forecasts. The growth is supported by the expectation of a colder winter in US Northeast and Midwest, partly offset by higher gas prices and slightly lower share in the power generation sector.
The temperature from December 2016 through March 2017 are projected to average 3% warmer than normal, but this forecast is 13% colder than the same period last year, according to the National Oceanic and Atmospheric Administration. Colder winter temperature will lead to an increase in commercial and residential gas consumption this year.
According to EIA, gas will generate 33% of the country's power this year, compared with 34% last year. Coal is able to regain some share from gas at higher gas prices. Gulf Coast petrochemical plants also add demand, but petrochemical plants experiencing some delays in expected in-service dates.
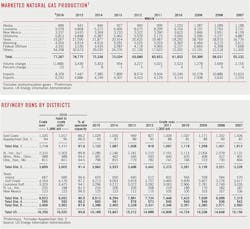
US production has declined in 2016, but likely to resume growth in 2017 as producers increase drilling and oil production increases associated gas volumes. Shale gas wells continue to be the largest source of total gas production.
For the fourth consecutive year, Pennsylvania saw the largest total gain in annual production, with marketed production increasing to an estimated 14.5 bcfd in 2016, up from 13.18 bcfd in 2015 and 11.6 bcfd in 2014. Texas remained the largest gas producing state, but the state's production declined 9.9% last year to 19.5 bcf/d.
Gas prices at Henry Hub declined more than 40% to $2.62/MMbtu in 2015 from an average of $4.55/MMbtu in 2014. Gas prices in 2016 averaged even lower at $2.5/MMbtu. However, as weather likely brings cold air, Henry Hub gas prices rebounded to an average $3.57/MMbtu in December, the highest since Dec. 2014, compared to $1.93/MMbtu during the same period in 2015.
Although 2016 inventories were 6% more than their 5-year average, the surplus has been shrinking. The increase in US working natural gas inventories through the 2016 injection season-the period from April through October when most gas is stored underground to help meet heating demand during the upcoming winter-was 45% less than the build last year and 37% smaller than 5-year average increase during the comparable time.
Estimated gas exports in 2016 increased tremendously by 27.9% to 2.3 tcf. LNG exports increased to 186 bcf in 2016 from 28 bcf a year ago. Pipeline exports increased 19.4% to 2 tcf.
The amount of US gas moving to Mexico will continue to increase this year because of growing demand from the country electric power sector and flat gas production.
Houston-based Cheniere Energy Sabine Pass LNG terminal in Louisiana is consuming about 1 bcfd gas since Train 2 started producing LNG in July, and is expected to double that capacity this year. There are currently four LNG export terminals in the US under construction.
