Emerging markets account for all growth in oil use forecast in 2014
Topics Covered in the Webcast:
- Key influences in the global and US oil markets
- How past forecasts compared against actual historical data
- Forces influencing global oil demand, supply, and prices
- Major trends in US oil product markets
- How oil and gas from unconventional resources are reshaping markets in the US and around the world
View Industry Forecast and Review Webcast Now |
Conglin Xu
Senior Editor-Economics
Laura Bell
Statistics Editor
While economies of the US and most other industrialized countries will strengthen this year, all of the world's oil consumption growth of 1.1 million b/d will occur in emerging markets. This sustains a well-established trend. Economic growth is fastest in the industrializing world, and factors such as energy-efficiency gains and underlying macroeconomic concerns moderate projections for oil demand in developed economies.
Meanwhile, the dramatic oil supply increase outside the Organization of Petroleum Exporting Countries, boosted by the US shale revolution, is challenging the market share of traditional oil exporting countries. OPEC's output strategies thus face unprecedented challenges.
US production of crude oil and lease condensate and of NGL will continue to increase this year while the country's oil demand will be subdued, mainly due to improved new-vehicle fuel economy and increased use of renewable energies. Net imports will be down, and crude inventories will be pushed up by surging production.
Natural gas production in the US will increase as well, its growth larger than that of last year. However, gas demand is projected to decline due to a diminished share of the electric power market.
World economy
The International Monetary Fund's (IMF) latest World Economic Outlook, published in October 2013, puts 2014 worldwide economic growth at 3.6%, up from the 2013 growth rate of 2.9%. However, the risks to the forecast remain to the downside amid lingering long-run problems and policy uncertainties.
In the October outlook, advanced economies as a group are projected to grow 2% this year, compared with 1.2% last year.
The euro area finally moved out of recession after the second quarter of 2013. Fiscal tightening in most euro-zone economies will fade over the next 2 years. However, as stated by the European Central Bank (ECB), the recovery is fragile due to banking-system weakness and tight credit. The IMF predicted growth of 1% for the euro zone in 2014.
Japanese economic growth has been strong, spurred by a combination of monetary easing and fiscal stimulus since Prime Minister Shinzo Abe came to power in December 2012. Sustainability of the recovery depends on further structural reforms. Meantime, an increase in the consumption tax from 5% to 8% planned for April is expected to generate a contraction in real gross domestic product (GDP).
Growth prospects among emerging economies are mostly limited, reflecting cyclical factors and a decrease in potential output growth, according to Olivier Blanchard, chief economist of the IMF.
China's economic growth is expected to decelerate to 7.3% this year from 7.6% last year and 7.7% in 2012 as the country's expansion becomes sustainable. The lower rates of Chinese growth might spill over to developing Asia and Latin America through trade.
Emerging markets are also exposed to tighter external financing conditions as global capital flows decelerate in response to the US Federal Reserve System's slowdown in quantitative easing, a program of aggressive purchases of financial assets from commercial banks aimed at stimulating the economy.
Worldwide oil demand
In its recent Monthly Oil Market report, the International Energy Agency forecast average global oil demand of 92.1 million b/d this year, up from last year's 91 million b/d. In 2012, demand averaged 90 million b/d.
Oil demand among the industrialized countries of the Organization for Economic Cooperation and Development (OECD) will be 45.5 million b/d this year, down 0.4% from IEA's estimate of 2013 OECD demand.
Demand in European members of the OECD is projected to fall 0.7% to 13.5 million b/d for the year. Lingering macroeconomic concerns and continuing gains in energy-use efficiency will keep postrecession oil demand from increasing.
In OECD countries of the Asia-Pacific region demand will decline to an average 8.2 million b/d in 2014 from 8.4 million b/d last year. North America's oil demand this year is unchanged from 2013, according to IEA: 23.7 million b/d.
Outside the OECD, total oil demand is projected to average 46.7 million b/d this year, up by 1.4 million b/d from last year.
Oil demand in China will climb to an average 10.6 million b/d in 2014 vs. last year's 10.2 million b/d. China's more moderate economic growth after 2011 has dampened growth in consumption of liquid fuels. Oil demand elsewhere in non-OECD Asia will increase by 300,000 b/d this year.
In Latin America, the Middle East, and Africa, average oil demand will grow by 200,000 b/d from a year ago, IEA forecasts.
Global oil supply
Oil supply from non-OPEC countries will increase 3.3% this year to average 56.5 million b/d, according to IEA.
Total OECD production will average 22 million b/d, 1 million b/d up from last year. North America will register 6% production growth to average 18.2 million b/d this year, following growth of 8.2% last year.
Combined oil output from countries of the former Soviet Union will average 14 million b/d, up from 13.8 million b/d last year. Latin America's output is projected to grow by 200,000 b/d this year.
For the fourth quarter of 2013, OGJ estimates that OPEC crude production was 29.8 million b/d, making average total output of crude and NGL by organization members last year 36.8 million b/d, 2% lower than in 2012. The reduction was mostly due to outages in some OPEC producers and a production cut in Saudi Arabia as demand for OPEC crude shrunk.
At its Dec. 4, 2013, meeting in Vienna, the organization agreed to leave its production target unchanged at 30 million b/d for the first 6 months of 2014, though Iran and Iraq have signaled substantial oil output increases. However, increasing non-OPEC supply indicates a further squeeze on OPEC's share of the oil market in 2014, given current price levels. OGJ expects OPEC crude production to decline to 29.9 million b/d this year.
OGJ's assumptions about supply from OPEC yield an average build in oil stocks in 2014 of 900,000 b/d.
Crude oil prices
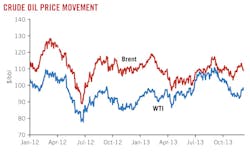
Brent crude oil spot prices in 2013 fell to an estimated average of $108.41/bbl from $111.65/bbl a year earlier. As world consumption growth is outpaced by non-OPEC supply growth, the Brent oil price will continue to decline in 2014.
West Texas Intermediate (WTI) crude oil spot prices, which averaged $94.12/bbl in 2012, increased to $97.64/bbl last year, according to preliminary data.
After closing the gap with Brent in July 2013 by seasonal demand and eased infrastructure bottlenecks, the discount on WTI oil has widened again to $18/bbl last November. As new pipeline capacity is added from the storage and pricing hub at Cushing, Okla., to the Gulf Coast, the average spread between Brent and WTI is expected to fall to $9/bbl from $10.80/bbl in 2013 and $17.50/bbl in 2012, according to US Energy Information Administration.
The Federal Open Market Committee (FOMC) is trimming its monthly bond purchases to $75 billion from $85 billion in January taking the first step in tapering its monetary policy of quantitative easing. Because this program has supported crude oil prices by weakening dollars, the tapering is expected to suppress crude prices.
US economy
US real GDP increased at a rate of 4.1%/year in the third quarter of 2013, according to the US Bureau of Economic Analysis (BEA). In the second quarter, real GDP increased 2.5%, following a first quarter gain of 1.8%.
The increase in real GDP in the third quarter primarily reflected higher private inventory investment, personal consumption expenditure, fixed investment, exports, and state and local government spending. Partly offsetting those boosts to GDP was diminished spending by the federal government, the BEA said.
OGJ forecasts that US real GDP will increase 2.4% this year as economic fundamentals continue to improve. US economic growth will also benefit from the boom in development of unconventional oil and gas resources, which supports exports, employment, and investments.
Diminished federal spending is expected to continue hindering GDP growth in 2014, but the drag will not be as dramatic as observed in 2013. State and local governments will continue to spend with stronger tax collections.
The inevitable phaseout of quantitative easing by the Federal Reserve responds to improvement in the labor market and should help balance economic growth.
Energy consumption
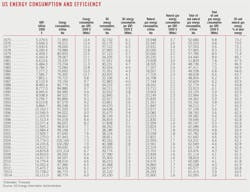
The US used a total of 96.77 quadrillion btu (quads) of energy in 2013, up 1.9% from a year earlier, as demand increased for all sources.
As energy-use efficiency continues to improve, OGJ projects total US energy demand this year of 96.78 quads, with declines in oil, gas, and nuclear consumption and increases in the use of coal and renewable energy.
Oil demand in 2013 rebounded to 35.12 quads, posting a 1.6% gain from a year earlier. With continued improvements in new-vehicle fuel economy, OGJ forecasts that oil demand this year will be down 0.1% from 2013, totaling 35.1 quads.
Natural gas demand will decline to 25.9 quads this year, bringing the energy market share for gas to 26.8%. For the past 12 months, natural gas had a 27.2% share of the US energy mix, down from 27.4% in 2012.
Together, oil and gas will account for 63.1% of the US energy market, 0.4% lower than last year. In 2012, oil and gas represented 63.8% of the market.
Coal demand in 2014 is expected to increase by 2.2% to 18.52 quads, following a 4.4% increase last year, as rising gas prices enable coal to gain share of the electric power generation market despite retirement of old coal-fired plants and environmental regulations that discourage the addition of coal-fired capacity.
OGJ expects the use of nuclear energy to decline 1.9% this year to 7.96 quads. Nuclear will account for 8.2% of the energy market, compared with 8.4% last year. The decline forecast is based on increased nuclear plant retirement due to lower electric power prices and higher repair costs.
Energy use from hydro and other renewable sources will climb 2% this year to 9.3 quads. These sources, which include solar, wind, geothermal, and biomass, will combine to account for 9.6% of all energy used in the US this year.
US oil production
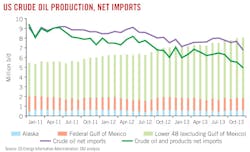
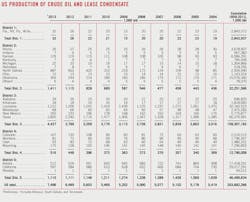
US production of crude oil and lease condensate is forecast to climb 13.9% this year, reaching 8.54 million b/d. In 2013, preliminary data indicate that US crude oil output grew by 1.01 million b/d, about 15.5%.
The production gains are driven by tight oil developments in Texas, North Dakota, and other locations, helped by increased drilling efficiency and well productivity.
North Dakota's output reached a record 887,000 b/d in 2013, representing an increase of 33.8% over the previous year. Crude oil production in the Bakken region was estimated to top 1 million b/d in December 2013.
Texas crude oil production averaged 2.83 million b/d in 2013, an increase of 26.5% over 2012, thanks to surging output from Eagle Ford and Permian basins.
Alaskan production, by contrast, continues to decline, averaging an estimated 512,000 b/d last year, down from 526,000 b/d a year before.
NGL supply also is expanding as operators favor shale and other low-permeability reservoirs holding crude oil and wet natural gas.
OGJ forecasts that 2014 NGL output will increase 2.8% to average 2.6 million b/d. This follows a 5.1% climb in production last year.
Imports, exports
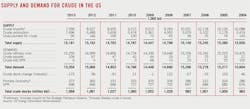
Surging oil production and stagnant consumption have cut imports of crude oil. OGJ forecasts that 2014 US crude oil imports will decline 13% to 6.6 million b/d. This follows an 11% decline last year to 7.59 million b/d.
The largest exporter of crude oil to the US last year was Canada. The country has held that position since 2004. The US imported an average 2.47 million b/d of crude from Canada last year.
The second largest source of US imported crude last year was Saudi Arabia, with 1.3 million b/d. Following Saudi Arabia were Mexico, Venezuela, and Colombia. Total imports from OPEC countries last year were 3.27 million b/d, down by 760,000 b/d from 2012.
US product imports in 2013 increased 1.3% to 2.097 million b/d. Distillate and residual fuel imports increased 19% and 44% respectively. Canada and Russia were the sources of the most products imported by the US last year.
US exports last year averaged 3.45 million b/d, with distillate exports accounting for 33% of the total. Of total oil exports, products account for 98%.
OGJ forecasts that US oil exports will increase 7.1% to average 3.69 million b/d this year. While the US remains a net crude oil importer, it is a net exporter of products, exporting a forecast 1.37 million b/d more than it imports this year after an estimated 1.245 million b/d in 2013.
Inventories
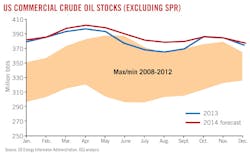
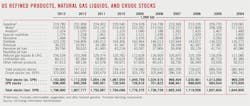
Total industry stocks of crude and products in the US were an estimated 1.8 billion bbl at the end of 2013, 0.5% lower than the previous year. Crude oil inventories, excluding crude in the Strategic Petroleum Reserve (SPR), finished 2013 at an estimated 372 million bbl, 1.9% above the same time a year ago. Product stocks at the end of last year were estimated at 730 million bbl, down 2.3% from a year earlier.
Rising US production is changing the seasonal pattern of US crude oil stocks. According to EIA data, US commercial crude oil stocks in the first 5 months of 2013 averaged 388.5 million bbl. At this level, they were 5.8% above the same period a year earlier and 8% more than the 2009-12 average. After an accumulated seasonal drop of 21 million bbl between May and September, crude stocks rebounded in October and November on lower refinery runs to 385.7 million bbl, which was 9.7% higher than the 2009-12 average. OGJ expects this pattern to continue in 2014.
In contrast to crude stocks, US stocks of oil products throughout 2013 were within the range of the past 4 years. Product stocks plunged by 30.5 million bbl in October, roughly double the 5-year average withdrawal for the month, due to refinery maintenance and subdued refining margins.
Total gasoline inventories finished 2013 at an estimated 220 million bbl, 5.2% lower than a year earlier. Distillate fuel stocks ended 8.7% below their year-earlier level.
Refining, prices
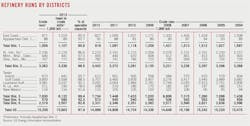
Refiners operated at relatively low levels last year due to maintenance and refining margins under pressure from weakening product markets and rising prices for US crudes.
With operable throughput capacity at US refineries of 17.81 million b/d, utilization averaged 87.9%, 1% lower than a year ago. OGJ expects a similar utilization level this year as the market fundamentals will likely persist.
Last year's average refining capacity, up 2.8% from the 2012 level, is expected to extend through 2014. Crude runs, up 1.7% to 15.25 million b/d last year, are projected to increase 0.5% this year.
The average US wellhead price of crude oil in 2013 increased to an estimated $96.41/bbl from $94.52/bbl a year earlier. The average landed cost of imported crude oil decreased to an estimated $99.37/bbl from $101/bbl. The composite refiner acquisition cost of crude oil averaged an estimated $101.78/bbl last year, up from $100.93/bbl the prior year.
Cash margins in the first 10 months of last year averaged $25.30/bbl for Midwest refiners, $16.20/bbl for West Coast refiners, $7.10/bbl for Gulf Coast refiners, and $2.60/bbl for East Coast refiners, according to Muse, Stancil & Co. Over the same period of 2012, averaged margins were $27/bbl in the Midwest, $15.60/bbl on the West Coast, $9.30/bbl on the Gulf Coast, and $5.10/bbl on the East Coast.
Oil product demand
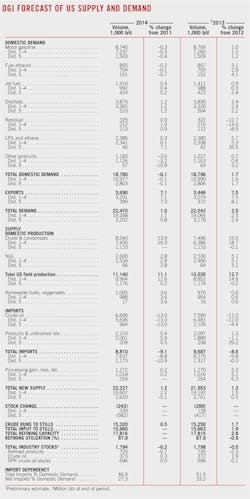
OGJ forecasts that total US oil demand will decrease 0.1% this year to 18.78 million b/d after a 1.7% increase last year.
Demand for motor gasoline will average 8.74 million b/d this year, down from 8.77 million b/d last year. The decline in motor gasoline consumption is mainly due to fuel efficiency gains boosted by continuously improved new-vehicle fuel economy, which outpaces growth in highway travel.
Regular unleaded pump prices declined in the fourth quarter of 2013 after a gradual build earlier in the year, driving the annual price at an estimated $3.50/gal. This compares with $3.64/gal a year earlier, according to EIA figures.
OGJ forecasts a 0.4% increase in jet fuel consumption this year after a 0.9% increase last year. Demand for distillate fuel oil will grow a further 1.2% following a 2.4% increase last year due to increased trucking, rail, and marine commercial transportation. OGJ forecasts that in 2014, distillate demand will average 3.87 million b/d.
Use of fuel ethanol in the US last year increased 3.1% from a year before. As the demand for ethanol is largely moving together with US finished motor gasoline consumption, OGJ expects fuel ethanol demand to decline 0.2% this year to 855,000 b/d.
Natural gas market
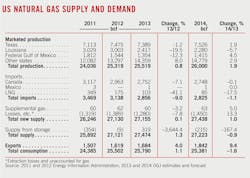
Total US consumption of natural gas will decrease 1.6% this year to 25.38 tcf following a 1.1% increase last year.
Generation of electric power accounted for 35% of total end-use gas consumption in 2013, down from 40% in 2012. According to EIA, for the first 11 months of 2013, natural gas consumption in the electric power market decreased by nearly 13% from a year before due to price increases for gas relative to coal and cooler summer weather. Natural gas demand this year will continue to lose share of the electric power market due to the projected year-over-year price increases.
Industrial gas consumption in 2013 through November was up 3%, or 600 MMcfd, from the same period of 2012. As the US economy grows and additional gas-intensive manufacturing capacity comes into operation, industrial demand for natural gas will continue growing in 2014.
The amount of natural gas used for residential and commercial space heating increased to 22.47 bcfd in 2013 from 15.92 bcfd a year earlier due to below-normal winter temperatures. It will slip this year to 21 bcfd.
In 2013, the New York Mercantile Exchange near-month futures price of gas averaged $3.67/MMbtu, compared with $2.82/MMbtu a year earlier. The average Henry Hub natural gas spot price increased in 2013 to an estimated $3.70/MMbtu from $2.75/MMbtu in 2012.
US marketed gas production increased 0.8% last year, according to early estimates. Production from Louisiana declined nearly 19.5%, and Texas production was down 1.3%. Output from the federal Gulf of Mexico areas decreased almost 12.3%. Production from other areas increased 8% to 14.36 tcf and accounted for 56.3% of total gas output for the year.
OGJ forecasts that US marketed gas production will increase nearly 2% this year to 26 tcf. Production from the Gulf of Mexico will increase 4.5%, while Louisiana output will decline by a further 5.7%.
During 2013, US imports of natural gas decreased 9% to average 2.85 tcf. Almost 41% less LNG and 7.1% less Canadian gas reached the US last year. Imports will continue to shrink this year. OGJ forecasts a 1.1% decline in total imports as LNG imports fall 17.5% to 85 bcf.
Gas exports will climb by 9.4% this year to a total of 1.84 tcf. This follows a 4% increase last year.


