Balancing of the oil market to stay on course despite UK exit from EU
Solid movement toward oil-market balance should survive the surprise UK vote on June 23 to withdraw from the European Union.
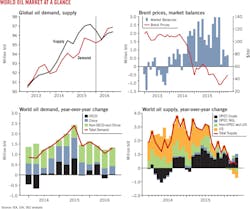
After falling to a 12-year low of $26.01/bbl on Jan. 20, the Brent crude price had climbed to nearly $51/bbl before the vote on the strength of rising oil demand, falling production outside the Organization of Petroleum Exporting Countries, and unexpected supply disruptions.
But the UK decision contradicted most expectations and threw markets into turmoil. For the oil market, the key question now is whether the UK-EU breakup harms the global economy enough to suppress growth in oil consumption. Unless it becomes the brake on international trade that some observers apparently fear, the answer probably is no.
The first-half recovery in oil prices was stronger than most analysts expected. In the first quarter, according to the International Energy Agency, average global oil demand exceeded the year-earlier average by 1.6 million b/d. Initial expectations for first-quarter demand growth were 1.2 million b/d.
In the US, gasoline consumption continues to surge. Despite wobbles among emerging economies, transport-fuel demand is also building in India, China, and Russia.
Although the UK referendum might damp oil demand by suppressing European economic growth, international oil consumption will continue to rise strongly this year as oil prices remain low in comparison with their levels before midyear 2014.
Non-OPEC oil production is slumping, largely driven by changes in US tight oil production. US crude oil production increased in 2015 by 723,000 b/d but will fall by 600,000 b/d this year, OGJ forecasts, unless the price recovery encourages more production than is expected.
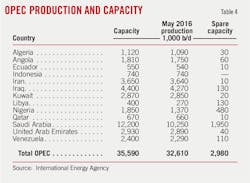
In its meeting in Vienna on June 2, OPEC chose not to reinstate an output ceiling, leaving members free to produce at will. OPEC crude oil production is expected to rise modestly this year, with Iran accounting for most of the increase.
Also in the first half, supply disruptions grew, averaging more than 3.6 million b/d in May, a record high. Some disruptions are expected to subside, while others will endure.
In the global gas market, massive new LNG capacity is starting up, while-despite lower prices-demand continues to soften in traditional markets. These trends will keep spot gas prices under pressure and limit trade.
US natural gas supply continues to be robust, despite a drilling slump. Natural gas storage levels remain elevated, suppressing US gas prices.
World economy
The global economy is struggling to regain momentum. In its latest Global Economic Prospects in June, the World Bank lowered its 2016 global growth forecast to 2.4% from 2.9% projected in January.
With risks to growth increasing and inflation persistently below target, the European Central Bank and Bank of Japan are pursuing further policy accommodation, while the US Federal Reserve is extending its program of holding interest rates low.
The US, which represents 20% of global oil demand, remains in an economic expansion. Real gross domestic product (GDP) growth was reported to have been relatively weak early this year, but recent data on retail sales and motor vehicle sales point to higher consumer spending and GDP growth for the second quarter.
As warned by Federal Reserve Chair Janet L. Yellen, headwinds and uncertainties still loom, including weak business investment, weak productivity growth, weak net exports, economic challenges abroad, and the persistently sluggish rate of inflation.
Eurozone real GDP increased 2.2% on an annualized basis in the first quarter of 2016, and the latest data point to more growth in the second quarter, supported by domestic demand and supportive monetary policy. However, the British exit from the EU (Brexit) might threaten trade and investment and, by implication, growth and jobs.
Real GDP in Japan grew just 0.1% year over year in the first quarter, reflecting ongoing weakness of the Japanese economy.
Emerging markets and developing economies face many challenges, including exchange-rate pressures, capital outflows, and subdued global merchandise trade. For countries dependent on commodity production, prices until recently have been low.
The Chinese economy's latest short-term indicators point to sustained economic momentum, with industrial production, fixed-asset investment, and retail sales improving thanks to aggressive monetary and fiscal stimulus. However, China faces considerable challenges as it adjusts its economy to increase domestic demand's contribution to overall growth.
World oil demand
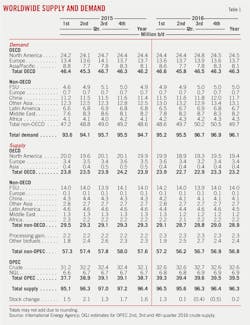
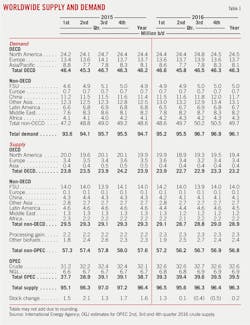
Global oil demand outperformed expectations in 2015, with full year growth at 1.8 million b/d. Demand grew by 500,000 b/d among industrialized members of the Organization for Economic Cooperation and Development and by 1.3 million b/d elsewhere. While demand growth in the fourth quarter of 2015 fell, it rose again in the first and second quarters of 2016.
According to the IEA's June Oil Market Report, global oil demand averaged an estimated 95.4 million b/d in the first half of 2016, up 1.5 million b/d from the first half of the prior year and 400,000 b/d more than predicted in January.
IEA's full-year 2016 global demand estimate stands at 96.1 million b/d, 1.4% higher than the prior year.
For 2016 as a whole, OECD demand is forecast to total 46.3 million b/d, up 0.3% from the year earlier. Demand will be up in South Korea, the US, and Turkey and down in Japan, France, Canada, and Italy.
Demand will grow by 1.1 million b/d in non-OECD countries, with the largest increases in China and other Asia. The non-OECD group will continue to be the main source of demand growth.
Despite economic headwinds, Chinese oil demand rebounded strongly in 2015 on the back of slumping crude prices. Chinese crude oil demand will remain well supported this year against the backdrop of low international oil prices, stockpiling, and refining, according to an analysis from FACTS Global Energy.
Indian demand has been exceptionally strong, propelled by rapid gains in road transport petrochemical. India's demand will grow 400,000 b/d in 2016, likely to be the world's biggest single increment, according to IEA.
India's demand will growth will be 8.3% year-over-year in the second half, while China's 3.3% demand growth will be greater in absolute terms.
Global oil supply
First-half supply disruptions occurred in Canada, Nigeria, Iraq, and Libya.
In Canada, wildfires in Fort McMurray, Alta., reduced oil sands production and led to an average 800,000 b/d supply disruption in May, with a daily disruption peak of more than 1.1 million b/d.
Nigeria's crude oil production fell to an average of 1.4 million b/d in May, its lowest monthly level since the late 1980s, due to militant attacks on oil and natural gas infrastructure. For the first 5 months of 2016, Nigeria's supply disruptions averaged 500,000 b/d, 200,000 b/d more than in 2015. IEA expects Nigeria's disruptions to remain relatively high through 2017.
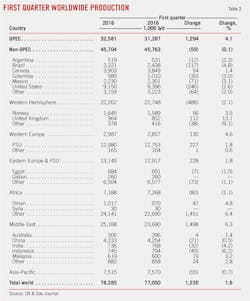
According to IEA, total OECD supply will average 23.2 million b/d this year, compared with last year's 23.9 million b/d. OECD North American oil output will average 19.4 million b/d, down from last year's 19.9 million b/d.
Average non-OECD oil supply will slip to 28.9 million b/d from 29.3 million b/d last year, led by the decline in China.
Offsetting the Nigerian decline among OPEC members is an increase in supply from Iran, where production increased by 730,000 b/d by May after relaxation of international sanctions.
OGJ expects total production of crude oil by OPEC members to remain at the first-quarter average of 32.6 million b/d. OPEC NGL output will average 6.9 million b/d this year.
Combined with IEA's outlook for demand, total 2016 oil supply of 96.3 million b/d would result in an average stock build of 200,000 b/d, compared with 1.3 million b/d last year. Stock withdrawals are possible in the second half as demand exceeds supply.
Commercial inventories in OECD countries rebounded from March levels by 14.4 million bbl to stand at 3,065 million bbl by end-April, 222 million bbl above the level of 2015.
US energy demand
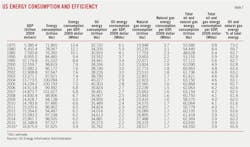
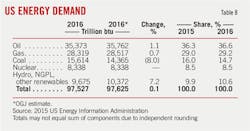
Total energy demand in the US this year will grow by 0.1%, and energy efficiency will improve to 5.9 Mbtu/$ of GDP from last year's rate of 6.0 Mbtu/$ of GDP.
Oil will still constitute the largest share of the US energy mix: 36.6%. Total energy use will be 35.76 quadrillion btu (quads), an increase of 1.2% from last year.
In light of low prices and rising demand for electric power generation, natural gas demand will reach 28.52 quads, accounting for 29.2% of the energy mix this year. In 2015, US demand for gas totaled 28.32 quads.
Coal consumption is forecast to decline by 8% in 2016 due to coal-gas switching in power generation, permanent coal-plant retirements, and a warmer-than-normal winter.
US oil consumption
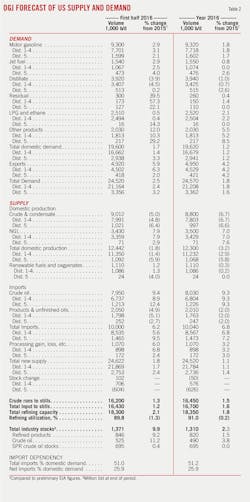
Total US liquid fuels consumption, driven by gasoline, will increase 1.2% to 19.62 million b/d in 2016. US oil consumption increased 1.5% in 2015 to 19.39 million b/d.
Backed by lower retail prices, gasoline consumption increased 2.67% in 2015 to an average of 9.16 million b/d. During this year's first 6 months, estimated gasoline consumption averaged 9.3 million b/d, compared with 9 million b/d for last year's first half, according to EIA data.
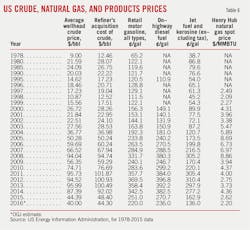
Gasoline regular-grade retail prices averaged $2.07/gal in this year's first half, down from $2.55/gal a year earlier, due to increased supply.
This year's gasoline consumption is projected to increase by 160,000 b/d to 9.32 million b/d, the highest annual average gasoline consumption on record. The previous annual average high was 9.29 million b/d in 2007.
Lower jet fuel prices have translated into lower passenger fares and increased flights and routes. Jet fuel consumption jumped 4.7% in 2015 to 1.54 million b/d. OGJ forecasts that jet fuel demand will increase by 0.8% to 1.55 million b/d this year due to improvements in airline fleet fuel economy.
Consumption of distillate fuel fell 1.5% in 2015 to 3.97 million b/d and will continue to fall in 2016 as the result of relatively high winter temperatures, less demand from drilling, and falling coal production. Also, proposed fuel economy and greenhouse gas emission standards would increase fuel economy and reduce diesel consumption in medium and heavy-duty vehicles.
LPG demand will also increase this year, supported by increased ethane consumption due to expansion of the capacity to produce ethylene.
US oil production
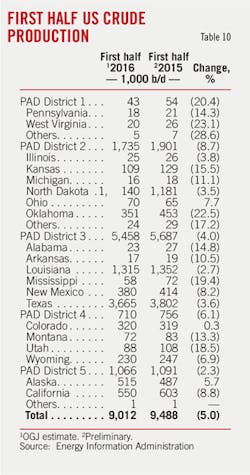
US crude and condensate production will decrease to 8.8 million b/d in 2016 from an average of 9.43 million b/d in 2015. In the first half of 2016, estimated US crude and condensate production averaged 9 million b/d. This was andecrease from 9.49 million b/d in 2015's first half. The decline in the Lower 48 onshore is partially offset by higher production in the federal Gulf of Mexico.
In its Drilling Productivity Report, the US Energy Information Administration said oil production from seven major US shale plays fell from 5.45 million b/d in May 2015 to 4.87 million b/d in May 2016. The fall included a 370,000 b/d, or 22%, drop in the Eagle Ford to 1.27 million and a 158,000 b/d, or 13%, drop in the Bakken to 1.07 million b/d. Production in the Permian area increased 126,000 b/d over the same period.
The number of oil-directed drilling rigs operating in the US for the week of June 24 was 330, according to Baker Hughes Inc. This is down from 628 rigs a year earlier.
As oil prices reach $50/bbl, operators have started to complete wells previously suspended after drilling.
Rystad Energy, an independent oil and gas consulting firm, estimated that more than 90% of wells drilled but uncompleted (DUC) can be commercially completed at a West Texas Intermediate crude price of $50/bbl. The firm expects horizontal oil completion activity in US shale plays to outpace drilling by 30% in the second half of 2016, resulting in the contraction of the DUC inventory by 800 wells. These completions will add 300,000-350,000 b/d to yearend production rate.
Wood Mackenzie projects WTI to reach $60/bbl in 2017 and suggests a rig recovery could start to gain momentum toward the end of 2016 and into 2017.
IEA also stated that, following the recovery in oil prices to $50/bbl and a market closer to balance next year, a slight uptick in completions is expected through 2016 and into 2017.
Natural gas liquids and liquefied refinery gases output will increase to 3.5 million b/d this year from last year's 3.27 million b/d. Most of this growth is expected to come from additional ethane and propane production following increases in demand for petrochemical feedstock in the US and abroad.
Imports, exports
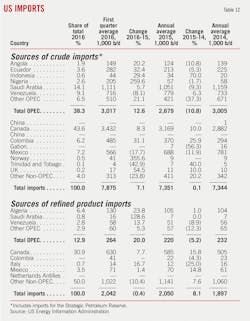
US imported an estimated 7.9 million b/d of crude during this year's first half, up from an average of 7.35 million b/d last year, reversing a years-long decline. For the full year, oil imports will remain elevated and average 8 million b/d, OGJ forecasts.
Crude imports are trending up due to falling US oil production, higher demand from refineries, and the relative price strength of WTI and Louisiana Light Sweet crudes relative to Brent.
During this year's first quarter, the leading source of US crude imports was Canada, which supplied 3.43 million b/d, 43.6% of the total. Next was Saudi Arabia at 1.11 million b/d then Venezuela, at 716,000 b/d, and Mexico, 566,000 b/d.
Total US crude imports from OPEC increased 12.6% in the first quarter, compared with a contraction of 10.8% last year. Imports from Nigeria surged to 269,000 b/d in March, compared with an average of 57,000 for all of 2015. Imports from Saudi Arabia also surged to 1.26 million b/d in March from January's 1.05 million b/d.
Crude imports from non-OPEC countries averaged 4.85 million b/d for the first 3 months of 2016, compared to an average of 4.67 million b/d for full year 2015.
High US output of oil products and full inventories dampen product imports. According to the American Petroleum Institute, gasoline imports declined to 584,000 b/d in this year's first 5 months from 647,000 b/d over the same period last year.
US exports of petroleum products continue to increase, while crude exports decline. Total exports will increase 4.2% to 4.9 million b/d this year following a 13.7% increase last year.
Currently, about 50% of product exports move to South America and Latin America, with Europe, Asia-Pacific, and Canada receiving about 13% each (OGJ Mar. 7, 2016).
The share of domestic demand met by net imports will be 25.9%, compared with 23.9% in 2015, 26.7% in 2014, and 32.9% in 2013.
US inventories
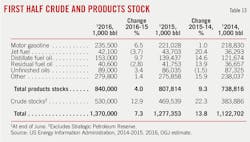
US industry stocks of crude at midyear stood at 530 million bbl, up from 469 million in the first half of 2015 and well above the 5-year average. Crude in the Strategic Petroleum Reserve (SPR) remains at 695 million bbl.
EIA data show that US crude oil storage capacity utilization rises even as storage capacity grows. Weekly commercial crude oil inventories have increased by more than 71 million bbl, or 15%, since the end of September last year, pushing crude oil storage capacity utilization to a near record high of 73% for the week ending June 10.
From September 2015 to March 2016, the US added 34 million bbl-6%-of working crude storage capacity, the largest expansion of commercial crude oil storage capacity since EIA began tracking such data in 2011. The largest commercial crude oil storage capacity expansions since September were in the Midwest and Gulf Coast, which added 19 million bbl and 13 million bbl, respectively.
Inventories of gasoline and distillate have been above the 5-year historical range for most of 2016.
At the close of the first half of 2016, gasoline stocks were up 6.5% from a year earlier at 235.5 million bbl, while distillate stocks were up almost 10% from a year earlier at 153 million bbl, OGJ estimates.
Refining
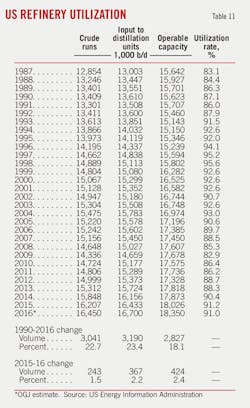
Refinery utilization will average 91% this year on operable capacity of 18.35 million b/d, OGJ forecasts. Last year, refineries ran at 91.2% of capacity on average.
During this year's first half, refinery utilization averaged 89.8% on operable capacity of 18.3 million b/d, compared with utilization 90.5% on operable capacity of 17.93 million b/d during last year's first half.
Refineries were running at maximum levels in the Gulf Coast, with several refineries back from maintenance. This compensates for lower levels in other areas, possibly reflecting diminished supplies of Canadian crude.
According to Simmons & Co., declining US onshore light oil production and transportation infrastructure development have narrowed inland light crude differentials. Medium and heavy crude production has been more resilient with the exception of temporary outages caused by one-time events such as Canadian wildfires. High-complexity refineries are expected to benefit from continued healthy medium and heavy crude oil discounts.
Gasoline crack spreads are under pressure due to higher production and elevated inventories. Distillate margins remain weak.
According to Muse, Stancil & Co., for the first 5 months of this year the Gulf Coast and Midwest cash refining margins averaged $10.03/bbl and $9.82/bbl, down respectively from $11.81/bbl and $15.94/bbl a year earlier. East Coast and West Coast margins averaged $3.17/bbl and $13.11/bbl, compared with $5.87/bbl and $22.88/bbl during the first 5 months of last year.
Natural gas market
Front-month futures prices for gas averaged about $2.01/MMbtu in this year's first half, compared with $2.77/MMbtu for last year's first half.
Gas drilling is down in response to lower gas prices. The number of gas-directed drilling rigs operating in the US for the week of June 24 was 90, according to Baker Hughes. This is down from 228 rigs a year earlier. The number of gas-directed drilling rigs in the Gulf of Mexico fell to 4 from 8 for the same period.
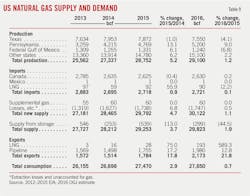
Despite reduced drilling, natural gas supply in the US remains strong. Over the first 5 months, marketed gas production averaged 79.35 bcfd, compared with 78.18 bcfd over the same period last year, according to EIA.
Production trends diverge across regions. Gross production in Texas, the largest gas-producing state, averaged 21.7 bcfd for the first 4 months of 2016, down 10% from the same period a year earlier, according to the Railroad Commission of Texas. Meanwhile, total marketed gas production in the Marcellus region averaged 17.5 bcfd for this year's first half, up from 16.2 bcfd a year earlier, according to EIA.
Several factors contribute to strong gas supply, including strong production from newly completed "legacy" offshore wells, strong production from shale gas plays as DUC wells come online, increased production efficiency, and improved takeaway capacity in the form of pipelines and processing plants in emerging areas such as the Marcellus shale.
Gas demand is projected to grow 0.7% this year following a 2.9% increase last year, OGJ forecasts.
This year's increases in total gas consumption are mainly attributable to increases in use for power generation, led by a combination of coal-to gas switching and permanent coal retirements. But a warmer-than-normal winter in the first quarter of the year reduced overall electricity generation.
According to the National Oceanic and Atmospheric Administration, the continental US summer on average will be 3% cooler than last summer but 8% warmer than the 30-year average. Compared summer-over-summer, the total number of cooling degree days is nearly identical to 2015.
Natural gas inventories in March ended at 2.5 tcf, the highest end-of-withdrawal-season level on record.
For the past several weeks, injections have been somewhat lower than the previous 5-year average. Despite lower-than-average injections, the record-high starting point of the injection season allows for a projected end-of-October record high.
The US continues to be a net gas importer. During 2015, it imported 7.4 bcfd of gas, mostly from Canada by pipeline, and exported 4.9 bcfd, mostly to Mexico by pipeline. Gross imports represented nearly 10% of total supply in 2015.
Imports from Canada have fallen steadily since 2007. This year, due to a warm winter and record gas storage, the AECO Hub price in Alberta sank to a big discount against the US benchmark. This may encourage more gas imports from Canada.
Deliveries from LNG regasification terminals in the US Northeast area have jumped. The crude price, used as a benchmark in many LNG contracts, fell, making imports competitive in the eastern US, where a lack of adequate pipeline capacity keeps local price high.
US exports to Mexico increased to a record 1.054 tcf in 2015 to meet increasing demand from new power plants. Higher production of gas from the US Gulf Coast and the Eagle Ford shale in southern Texas as well as new pipeline capacity contributed to the increase. Pipeline projects still under way in the US and Mexico will help to bring US pipeline exports to Mexico to record levels.
US LNG exports will increase substantially this year with the start up of Cheniere's Sabine Pass LNG liquefaction plant in Louisiana, which sent out its first cargo in February.
About the Author
Conglin Xu
Managing Editor-Economics
Conglin Xu, Managing Editor-Economics, covers worldwide oil and gas market developments and macroeconomic factors, conducts analytical economic and financial research, generates estimates and forecasts, and compiles production and reserves statistics for Oil & Gas Journal. She joined OGJ in 2012 as Senior Economics Editor.
Xu holds a PhD in International Economics from the University of California at Santa Cruz. She was a Short-term Consultant at the World Bank and Summer Intern at the International Monetary Fund.
Laura Bell-Hammer
Statistics Editor
Laura Bell-Hammer is the Statistics Editor for Oil & Gas Journal, where she has led the publication’s global data coverage and analytical reporting for more than three decades. She previously served as OGJ’s Survey Editor and had contributed to Oil & Gas Financial Journal before publication ceased in 2017. Before joining OGJ, she developed her industry foundation at Vintage Petroleum in Tulsa. Laura is a graduate of Oklahoma State University with a Bachelor of Science in Business Administration.
