Monitoring approach improves ability to predict, address compressor failures

Daniel Nelson
Novity
San Carlos, Calif.
Combining periodic in-person monitoring with a prognostics method for estimating rotational position from pressure readings enhances the ability to predict and address potential failures in reciprocating compressors. The most common failure point for reciprocating compressors is the valves. Typically, leakage through the valves is monitored using pressure-volume (PV) analysis, which often requires in-cylinder pressure to be synchronized with angular position.
American Petroleum Institute (API) Standard 670, starting with its fifth edition, includes a section dedicated to instrumentation on reciprocating compressors for condition monitoring and machinery protection. Such standardization of condition monitoring has made implementing condition-based maintenance and predictive maintenance more accessible to end-users, particularly with new machines. However, older equipment still requires significant effort to retrofit instrumentation capable of meaningful condition monitoring.
With the adoption of API standards for monitoring reciprocating compressors, nearly all modern compressors have monitoring points, including indicator tap ports on the cylinder housing and space for inclusion of multi-event wheels. Although installing cylinder-pressure transmitters in existing indicator tap ports can be done quickly, even while the compressor is running, installation of rotational position measurement equipment on compressors in operation is much more difficult. A typical installation requires shutting the compressor down and installing the sensor (and either a single-event or multi-event toothed wheel or band) on a rotating component, such as the coupling sleeve or the end of the crankshaft. Then, a reference target on the event wheel or band is aligned with the top-dead-center (TDC) of one of the cylinders, requiring removal of one of the valves to visually verify alignment. Hence, installation of rotational position measurement systems can prove problematic for older compressors that are already in service, particularly if the operational demands are high and installation time must be kept to a minimum.
In this article, a method for estimating rotational position from pressure is compared with rotational position measured by sensor on several compressors at a natural gas processing plant in the Permian basin operated by Battalion Oil Corp. Multiple three-stage compressors were instrumented with cylinder pressure transmitters and rotational position sensors, with the positions indicated compared with those estimated by pressure readings. The pressure method detected valve failures with virtually the same performance as a system with rotational position measurement installed. Furthermore, a prognostics method applied to the features extracted from the PV analysis predicted gradual valve failures several weeks in advance.
Instrumentation
Instrumentation typically recommended for PV analysis includes a measurement of the rotational position, or crank angle, relative to some reference location on the rotating elements. For example, the crankshaft position when one of the cylinders is located at TDC is often used. This rotational position is synchronized with the in-cylinder pressure measured using transmitters. Only one crank angle measurement per compressor is needed, but a pressure transmitter is needed for each cylinder volume. For example, a typical four-throw double-acting compressor will need one crank angle measurement in addition to eight pressure transmitters, two for each throw. One throw, with pressure transmitter installation sites, is illustrated in Fig. 1.
Measuring rotational position is most frequently accomplished using a crank-angle system or something similar, with which a wheel with teeth or indentations is fixed to the rotating shaft and a magneto-resistive sensor detects the passage of the indentations. Each indentation or tooth is aligned with a particular angle and so the rotational position can be mapped to the pulse signal generated by the rotation of the wheel with respect to the sensor.
High-bandwidth pressure transmitters installed in the indicator tap ports measure in-cylinder pressure, with an isolation valve between the sensor and the cylinder housing. The signals from the rotational position sensor and the pressure transmitter must be sampled at the same rate simultaneously, using multiplexing or similar to minimize the latency between the two signals. Modern multiplexed data collection hardware has switching rates on the order of a few nano-seconds, suitable for general purpose industrial gas compressors that normally operate under 1,800 rpm.
Pressure-volume analysis
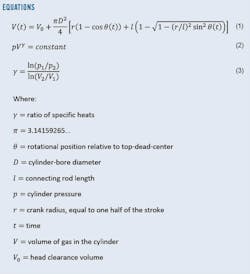
Comparing the synchronized pressure and volume estimates to a polytropic compression process allows leak detection. A polytropic compression or expansion process follows the relation given by Equation 2, where γ is the polytropic exponent. For an adiabatic process, the polytropic exponent is equivalent to the ratio of specific heats for the process gas.
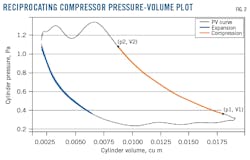
Knowing the cylinder pressure and gas volume allows estimation of the polytropic exponent for the expansion and compression phases of the pressure cycle. Choosing two points in the cycle allows estimating y with Equation 3, where γ is the polytropic exponent.
Fig. 2 shows that an exponent can be estimated for the expansion phase of the pressure-volume cycle as well as for the compression phase. The example in Fig. 2 shows a possible choice of pressure and volume points for the compression phase. Points can also be chosen for the expansion phase. When leakage is occurring through the valve, the measured value of the polytropic exponent will deviate from the ideal value.
Assuming an accurate measure of the rotational position, this method can be very effective at detecting leakage through valves and diagnosing the approximate site of the leak: either the suction side or discharge side. Additionally, the deviation in the polytropic exponent is directly related to fault severity, and so can be used to estimate fault severity as part of a failure prognostics method.
System installation
Battalion Oil operates a midstream processing plant, receiving sour natural gas from several wells and processing it into sweet gas. Several reciprocating compressors at the site bring the gas to pipeline pressures. Most are four-throw reciprocating gas compressors that compress both sweet and sour gas using three stages. Although the compressors are API Standard 618 compliant, they were originally instrumented with minimal machinery-protection sensors and switches and did not have pressure transmitters installed in the indicator tap ports, nor rotational position sensors. The compressors are typically run continuously, and any downtime could affect production, hence installation of additional monitoring equipment needed to be quick, non-invasive, and robust.
Several problems are associated with the installation and maintenance of rotational position sensors to compressors currently in service. The most significant are typically the hardware lead time and required installation time. Rotational position systems and crank-angle measurement instrumentation are not often readily available off-the-shelf and usually require several weeks to months of procurement time. Retrofitting a reciprocating compressor for crank-angle measurement also requires shutting down the compressor, followed by several hours of installation to clean the install location, install the multi-event band, align it with TDC, and install the position sensor with custom brackets to use only pre-existing tap locations. A solution that eliminates the need for a crank-angle measurement system or equivalent therefore can be very attractive.
To validate a solution that does not require rotational position measurements, several compressors at Battalion Oil’s processing plant were instrumented with crank-angle and cylinder-pressure sensors. Predictive maintenance algorithms were deployed to detect and predict valve leakage. Performance and results with and without the crank angle signal were compared.
Pressure sensors only
Elimination of the crank-angle system provides several advantages in addition to the reduced implementation costs. Since elements of the crank-angle system are installed on rotating components, maintenance requires the compressor be shutdown. Conversely, pressure transmitters can be replaced and serviced while the compressor is in operation if isolation valves are present. Additionally, the high-frequency signals do not need to be synchronized, allowing for more flexibility in data-acquisition hardware choices.
To eliminate the need for a separate sensor to measure rotational position for the volume calculation, the rotational position must be extracted from the pressure curve. To do this, several physics-based and statistical features that are generally stationary with respect to TDC location and various other angular positions are engineered directly from the pressure signal. These features and their corresponding rotational positions reconstruct the rotational position as a function of time for a given pressure signal. This is possible because several features in the pressure curve are synchronous with the rotation of the crankshaft.
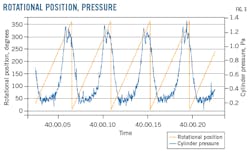
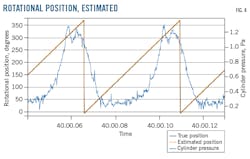
Fig. 3 shows an example of the rotational position overlayed against a pressure signal. The TDC location is the point on the rotational position curve at which the position changes from 360° to 0°. Fig. 3 depicts this as near the position where the discharge valve closes and the expansion phase begins. Fig. 4 compares estimated rotational position against true position, along with two cycles of the pressure signal. The error in TDC location was very small; generally, less than 2°.
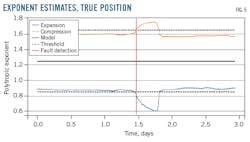
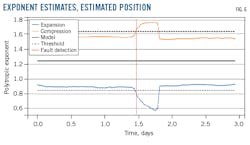
To demonstrate this, the expansion and compression exponents for a compressor fitted with a rotational position sensor over a 3-day period are shown (Fig. 5). About halfway through this period, a discharge valve fault occurred, resulting in a divergence of the exponents away from the isentropic value for the polytropic exponent, about 1.24 for natural gas. This divergence was detected by the algorithm and an alert generated several hours before the valve was replaced, as shown by the red line.
Predicting valve faults
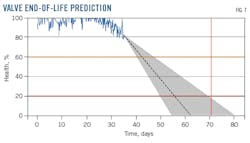
A prognostics approach addresses the shortcomings associated with anomaly detection by providing information on the trends in the tracked feature. Firstly, a feature must be chosen that is a strong indicator of the severity of the faults that the end user is interested in. With this condition met, trends in the feature tend to be noticeable long before thresholds are reached, including early-warning thresholds. Thus, a decrease in predicted remaining useful life (RUL) generally provides the earliest warning of an impending fault. Furthermore, since RUL estimations are computed from trends in the data, they are usually very resistant to noise in the feature.
A prognostics algorithm was implemented on the instrumented compressors. The algorithm provided much earlier warning of future valve faults as compared with anomaly detection, as well as explicit estimation of RUL for the equipment being monitored.
In general, predicting reciprocating compressor valve failures is difficult because degradation is highly non-linear and occurs at various timescales. To address this, an intelligent prognosis approach was used that adapted the level of nonlinearity and the timescale of the degradation to the historical data available for each failure.
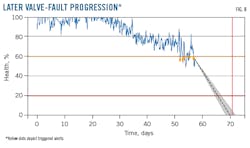
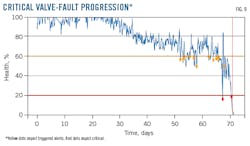
To illustrate the behavior of a prognostics approach, an example of a failure that progressed over the course of several weeks at the Battalion processing plant was examined over time. Fig. 7 shows RUL began to decrease in response to the downward trend in the data, long before the damage level had deviated significantly from healthy.
Incorporating PdM into processes
Before implementation of the valve prognostics solution, Battalion Oil relied on periodically measuring the valve cap temperatures with portable equipment to determine if there was a leaking valve. These measurements were expected to be performed daily, but this was not always the case depending on the daily maintenance workload and priorities. With the monitoring solution that was implemented, faults are tracked continuously, and alerts can be sent to field mechanics via text messages.
Using periodic monitoring and prognostics solution combined, Battalion has opened a 5-7 day warning window on equipment failure. This has allowed maintenance personnel to plan work and maintain more urgent requirements while using fewer people. Furthermore, early warning of valve failure allows maintenance to be performed during shifts in which down time is less expensive.
Biblography
American Petroleum Institute, “API Standard 618: Reciprocating Compressors for Petroleum, Chemical and Gas Industry Services,” Fifth Edition, December 2007.
American Petroleum Institute, “API Standard 670: Machinery Protection Systems,” Fifth Edition, November 2014.
Chesnes, J., Kolodziej, J., and Nelson, D., “A Statistical Classification Approach to Valve Condition Monitoring Using Pressure Features, Conference of the PHM Society, Nashville, Nov. 1-4, 2022.
Elhaj, M., Gu, F., Ball, A. D., Albarbar, A., Al-Qattan, M., and Naid, A., “Numerical simulation and experimental study of a two-stage reciprocating compressor for condition monitoring,” Mechanical Systems and Signal Processing, Vol. 22, No. 2, February 2008, pp. 374-389.
Griffith, W. A. and Flanagan, E. B., “Continuous Monitoring of Mechanical Condition and Performance for Critical Reciprocating Compressors, Turbomachinery Symposium, Houston, Sept. 17-20, 2001.
Pipeline Safety Trust, “Pipeline Basics & Specifics About Natural Gas Pipelines,” September 2015.
Schultheis, S. M., Lickteig, C. A., and Parchewsky, R., “Reciprocating Compressor Condition Monitoring,” Turbomachinery Symposium, Houston, Sept. 10-13, 2007.
The author
Daniel Nelson is a principal modeling engineer with Novity. He has more than 12 years of experience in multi-physics modeling of industrial equipment, with a particular focus on mechanical degradation and failure analysis. Nelson earned both his BS and his Ph.D. in computational physics from San Diego State University.