Airborne Angolan methane monitoring reveals discrepancies
Angola’s offshore oil and gas sector exhibits emission profiles reflecting infrastructure age and operational design. Newer deepwater floating production, storage, and offloading (FPSO) vessels, often connected to natural gas export infrastructure and equipped with modern emission control systems, generally display lower methane emissions and carbon intensities than older shallow-water platforms. The latter emissions come from fugitive releases and venting.
A report by the METHANE-To-Go Africa (MTGA) campaign examined Angola’s offshore emissions in detail and determined that inventory-based accounting overestimated newer FPSO emissions and underestimated older shallow-water platform emissions. Production volumes also poorly predicted methane emissions. Infrastructure type and maintenance status provided the strongest indicators of methane risk.
When compared with operator reports and gridded inventories, aircraft observations reveal consistent underreporting of fugitive methane by operators and potential overestimation of methane for modern FPSOs. The report recommended that operators and regulators prioritize monitoring of older shallow-water platforms for leaks and venting.
Implementing regular measurement programs and coupling this with improved reporting standards and recalibrated inventory-emission factors, will align Angola’s offshore emissions accounting closer to observations.
Methane emission reporting
Over the past decade, an accumulating body of research has revealed persistent gaps between bottom-up greenhouse gas inventories from activity data, standardized emission factors, and operator reports and direct measurement-based assessments of emissions from oil and gas operations. Inventories frequently fail to capture the complexity and variability of real-world emissions, especially for methane. By contrast, top-down measurements using aircraft, satellites, and ground-based instruments consistently indicate higher methane emissions than those reported through industry submissions.
These discrepancies arise in part because methane emissions often originate from a mix of intentional venting and inadvertent leaks which are difficult to quantify without direct detection. The Global Methane Pledge, launched at COP26, underscores the urgency of strengthening monitoring, reporting, and verification of methane in all sectors. Offshore oil and gas operations are particularly problematic when more robust observational evidence is needed.
Offshore environments, however, complicate methane detection and quantification. Satellite instruments struggle over water because the ocean’s dark surface reduces reflectivity for signals in key spectral bands needed to identify methane. As a result, satellites generally spot only the largest offshore plumes, typically under favorable meteorological conditions.
In Angola’s case, the smallest offshore plume identified by satellite was 0.8 tonnes/hr (tph), near the detection threshold. Airborne in situ mass balance methods presently offer the most reliable approach for quantifying offshore methane emissions because they combine relatively low detection limits with flexible spatial coverage and the ability to operate in cloudy or variable weather. Aircraft platforms outfitted with high-precision methane analyzers can sample plumes at multiple altitudes and across transects that envelop emission sources, enabling reliable flux calculations within the marine boundary layer.
Angola offshore production
Angola places among the top 20 countries by oil production, with about 1.17 million b/d of output in 2025. Its offshore sector includes two broad classes of infrastructure distinguished by age, design, and operating practice. Older infrastructure includes shallow-water platforms close to the coast, often assembled into complexes with multiple interconnected platforms and satellite wellheads. These structures are fixed on the seabed and typically date before 2000. The newer class of offshore developments consists of deepwater and ultra-deepwater operations producing through FPSOs.
The deepwater FPSOs connect to an underwater pipeline network which carries associated gas to the 5.2-million tonne/year Angola onshoreLNG plant in Soyo. The older shallow-water platforms, by contrast, tend to reinject, capture, or flare associated gas because they lack the economic incentive or infrastructure to export it. This structural divide drives the emissions profile across Angola’s offshore sector.
The MTGA campaign performed the first airborne measurement initiative in West Africa to understand the magnitude and location of methane emissions in Angola and evaluate the accuracy of bottom-up emission reporting. The campaign was financed by the International Methane Emissions Observatory (IMEO) of the United Nations Environment Program (UNEP) and the German Aerospace Center (DLR).
During 3 weeks in September 2022, the DLR Falcon research aircraft conducted flights along the coastal regions of Gabon, Congo, and Angola. The aircraft carried a suite of instruments for in situ detection of methane and related trace gases. The aircraft flew in a prescribed box pattern around targeted infrastructure or regions with the ceiling set at the planetary boundary-layer height (PBLH).
Angola’s offshore portfolio includes 36 shallow-water sites and 21 deepwater FPSO operations. The largest shallow-water complex includes 28 interconnected platforms and wellheads. For analytical purposes, each complex was treated as a single unit. In total, the campaign conducted 87 mass-balance measurements across 30 individual installations and ten groups that included 27 additional platforms.
Offshore infrastructure was grouped into geographic regions to optimize flights, with each region surveyed at least twice. Additionally, at least one dedicated facility-scale mass-balance flight was performed for each region, with coastal regions receiving three coverage passes.
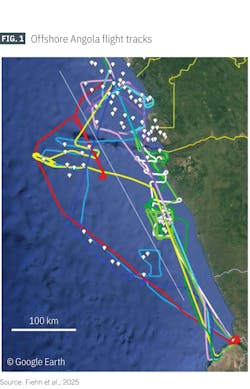
Fig. 1 shows tracks of the ten flights during the MTGA campaign with locations denoted by white indicators.
The thin white line divides shallow and deepwater sites. The blue line in Fig. 2 (left) shows the box pattern flown around two groupings outlined by red ovals at various altitudes to capture the entire plume along the northern wall. Red diamonds show locations and arrows denote wind direction. Fig. 2 (right) shows the emissions from three transects of the northern wall.
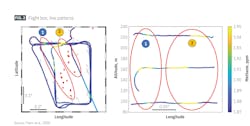
Emissions travel downwind, while turbulence spreads them horizontally and vertically until the plumes are well mixed from the ocean surface up to the PBLH. Upwind measurements determined inflow, and downwind measurements determined outflow. Emissions produced from the box derive from the mass balance between inflow and outflow.
Assumptions for the calculations include constant wind speed, wind direction, emissions, background concentrations, and PBLH during the sampling time with no entrainment-detrainment into the free troposphere. Other assumptions include a species lifetime longer than transport and sampling times, and a well-mixed trace gas plume between the lowest flight track and the ground. Under the meteorological conditions encountered in September 2022, these assumptions yielded a 29% mean uncertainty for methane fluxes.
Emission analysis
Data revealed a pronounced divergence in methane emissions by facility age and type. Infrastructure commissioned before 2000, typically shallow-water platforms, emitted roughly 0.44 tph, whereas facilities commissioned from 2000 onward, predominantly FPSOs in deep and ultra-deep waters, emitted only about 0.04 tph. These results are far below the lowest satellite recorded emission of 0.8 tph, reflecting the higher detection limit of airborne measurements vs. satellites.
This tenfold difference reflects more than a simple production correlation. It captures differences in infrastructure design, maintenance practices, emission controls, and gas infrastructure connectivity. For example, the highest-emitting sites are those commissioned before 2000 in shallow waters closer to the coast (operated by anonymized companies C, D, and F), but these locations have lower production volumes than the lower-emission modern deep and ultra-deepwater sites (operated by companies A, B, E, and G). This trend depends upon whether a particular production site is connected to the LNG plant. Associated gas from older production sites C, D, and F is not connected to the gas pipeline feeding the LNG plant and is reinjected, captured, or flared. This gas has little economic value, and leaks may not be discovered.
During the campaign, seven instances of special operations were reported across 87 measurements, but these did not coincide with high methane emissions. Rather, low emissions and one 0.3 tph medium-strength emission (during offloading at B3) occurred, indicating that when operators perform special operations, they pay attention to emissions. The lack of operator awareness during documented high-emission events, however, indicates that many fugitive releases occur outside of scheduled operations, highlighting the importance of persistent monitoring systems.
For example, measurements also captured intermittent high-emission events. One of the highest events produced 10.4 tph from shallow-water platform D3. The plume was recorded multiple times and remained observable downwind up to 75 km from the facility. Other flights, however, registered only 0.02 tph. The operator reported no anomalous activity during these flights, and the event may have been an unrecognized leak or operational malfunction.
Another production group operated by Company F displayed elevated methane emissions across three measurements taken over 4 days, exhibiting 3.5-4.1 tph initial rates and then about 1.3 tph 2 days later. Again, the operator reported normal operations, implying no immediate knowledge of fugitive emissions.
In contrast to the shallow-water platforms, deep and ultra-deepwater installations generally emitted near the detection limit. or no more than a few tenths of a tph. Sites operated by Companies B, E, and G exemplified this low-emission behavior. The onshore LNG terminal that processes natural gas from the deepwater fields also exhibited low methane emissions during the campaign’s measurements.
Plume composition analyses confirm that high methane emissions largely arise from leaks and venting rather than flaring or combustion. The largest methane plumes contained little carbon dioxide, while sites with high carbon dioxide emissions tended to exhibit low methane enhancements, a signature consistent with efficient flaring or turbine operations which oxidize methane to carbon dioxide.
Emission estimate comparison
The study compared measurement-based estimates with operator-reported data for 2021 and 2022, as well as against gridded inventories such as the IEA Methane Tracker, the Emissions Database for Global Atmospheric Research (EDGAR), and the Global Fuel Economy Initiative (GFEI). Operator data included facility characteristics and production metrics, daily operational status, periodic oil production, gas production, flared gas emissions, reinjected gas volumes, fuel-gas usage, lift-gas volumes, gas exported to Angola LNG, CO2 emissions from fuel and flaring, and methane from flaring and fugitive sources. In 2022 cases with incomplete data, 2021 annual data or conversion ratios from other operators were used to estimate emissions.
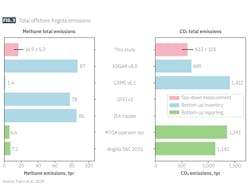
Analysis found that reported monthly emissions from operators matched calculated daily sums within about 1% for CO2 and 20% for methane, but the absolute levels of methane reported by operators were often substantially lower than aircraft-derived measurements (Fig. 3). On average, operator reported methane emissions underestimated observed methane emissions by roughly two-thirds.
Several operators focused their reporting on flare-related methane emissions and combustion CO2, frequently omitting comprehensive accounting of fugitive methane. For example, site C3 reported maximum methane emissions of 1.5 tph, yet measurements did not detect significant emissions from that site, indicating that flare accounting overestimated emissions. By contrast, D3 reported only 0.1 tph from flaring while measured emissions were dramatically higher during the high-emission event, showing that flare reporting alone was not sufficient to capture emissions at that site.
Newer high-production FPSOs tended to have operator-reported methane emissions which were higher than aircraft measurements, suggesting potential overestimation in inventory emission factors for modern offshore infrastructure.
The international Methane Emissions Observatory (IMEO) Methane Alert and Response System, which integrates data from about a dozen satellites, registered seven offshore methane plumes in Angola between November 2022 and August 2024. Six of these detections coincided with known installation groups, while one detection occurred in a region with development projects, possibly associated with a drilling ship or exploration. Differences between satellite and aircraft findings, such as the apparent persistence of emissions, are primarily attributable to detection thresholds and revisit–times rather than changes in behavior between overpasses. Because intermittent emissions can fall below satellite detection limits, aircraft provide complementary measurements.
Angola vs. the world
The study compared airborne estimates from Angola with measurements in other regions (Fig. 4). The mean methane emission per Angolan site was about 0.30 tph, with a strong divergence by age. Facilities commissioned before 2000 averaged 0.44 tph while newer facilities averaged 0.04 tph.
In the northern Gulf of Mexico, emissions from nine sites—some serving as central hubs akin to Angola’s legacy complexes—averaged about 0.46 tph. Typical emissions reported for the US Gulf of Mexico were about 0.02 tph for shallow-water platforms and 0.08 tph for deepwater platforms, a pattern opposite that of Angola because of that country’s use of FPSOs.
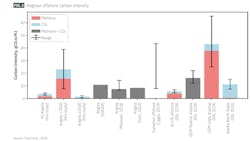
Despite these differences, both regions have older shallow-water platforms dominating facility counts and therefore exerting outsized influence on basin-wide totals. European offshore operations, which tend to be newer and operate under stringent regulations, reported lower average emissions of about 0.03 tph per platform in the Norwegian Sea and about 0.14 tph in the Southern North Sea. These comparisons emphasize that infrastructure age, design, regulation, and connectivity to gas utilization systems strongly shape methane emission intensities.
Emission inventory comparison
Comparison with gridded inventory methane tracking from IEA Methane Tracker, EDGAR, and GFEI suggests that bottom-up methods either overestimate or underestimate methane emissions, depending on underlying emission factors and the distribution of facility types. For Angola, country-level energy sector emissions reported by the IEA were 98 units (consistent with the MTGA report) with 86 attributed to offshore operations. Emission sources include fugitives (19%), venting (74%), and flaring (7%).
While these breakdowns align broadly with other methane tracking methods, MTGA concludes that inventory-based methane emissions for Angola were overestimated for newer FPSOs and underestimated for older shallow-water platforms. This pattern arises because inventories apply generalized emission factors which neither reflect the more effective modern FPSO emission control and gas export connectivity nor capture the fugitive and venting risks from aging shallow-water infrastructure lacking comprehensive monitoring.
Moreover, operator-reported emissions for 2021 and 2022 and Angola’s Second National Communication to the UNFCCC (with the last emission report covering 2015) were nearly three times lower than the aircraft-based observation estimates. All these discrepancies highlight the need for regular measurement-based verification to complement and calibrate bottom-up reporting systems.
Operators can typically calculate combustion-related emissions with relatively high precision because volumes of burned gas are monitored closely and must be reported. The study found that combustion systems—flares and gas turbines—generally operate efficiently, indicated by plumes with strong carbon dioxide signals and low methane enhancements, which means methane is being oxidized effectively when combustion occurs. The study recommended extending emissions sampling beyond the 3-week campaign to establish longer-term patterns, seasonal variability, and potential operational contingencies.
Overall carbon intensity
A particularly instructive outcome of the study is calculated carbon intensity by facility age and type. Carbon intensity reflects the amount of carbon equivalent released to produce a unit of energy. Methane emissions were converted to CO2 equivalent (CO2e) using a 100-year global warming potential (GWP100) of 29.8. The combined observed methane and CO2 Angolan offshore emissions amounted to 1,116.6 tonnes CO2e/hr, with methane and CO2 contributing roughly equally to this total.
Based on airborne measurements, the study estimated an overall 3.4 grams CO2e /MJ (gCO2e/MJ) carbon intensity for Angolan offshore oil and gas production during September 2022. This intensity is well below prior inventory-based estimates. For example, the EDGAR v8.0 dataset estimates 8.2 gCO2eq/MJ for the same period.
Older shallow-water platforms exhibited a carbon intensity of 23.2 gCO2e/MJ, with methane accounting for about 66%. Newer deepwater and ultra-deepwater FPSOs commissioned after 2000 displayed a carbon intensity of 1.38 gCO2e/MJ, with emissions dominated by carbon dioxide at about 92%, consistent with well-controlled methane pathways and efficient combustion.
Recommendations
The MTGA study determined that production volume is a poor predictor of methane emissions in Angola’s offshore sector, and inventories should not rely solely on production data to estimate methane releases. Instead, facility age, infrastructure type, and maintenance status are stronger indicators of methane risk. Operators and regulators should prioritize regular, high-resolution monitoring of older shallow-water platforms at which fugitive and vented emissions are more likely and potentially more severe.
Reporting frameworks need revision to require comprehensive accounting of fugitive methane emissions beyond flaring and combustion, and emission factors applied in national and international inventories should be reassessed for modern FPSOs to avoid systematic overestimation. Factors for aging shallow-water platforms should be reevaluated to reflect the real-world likelihood and scale of leaks and venting.
Based on these findings, the Angolan National Oil, Gas and Biofuels Agency and the Ministry of Mineral Resources, Petroleum and Gas, in coordination with local operators, are considering enhanced reporting requirements and mandates for methane reduction. Aircraft-based datasets target regulatory interventions for high-risk assets, and integration of satellite alerts, aircraft measurements, and operator reporting creates a layered monitoring system. This system would enable satellites to flag large events, aircraft to quantify emissions in detail, and operators to deploy rapid response protocols to locate and repair leaks.