Microelements predict deep coiled tubing pressure drop
Fujun Fang
Jianqiu Li
Xiaozhi Shi
Youbin Chen
Zhiyao Liu
Yuanyuan Li
Xiude Lu
CNPC Chuangqing Drilling Engineering Co., Ltd.
Sichuan, China
Recent advancements in ultradeep drilling have led to a worldwide surge in ultradeep wells, making them pivotal to the energy industry.1 Nitrogen lifting in coiled tubing (CT) is a widely used technique in starting and maintaining production. Nitrogen lifting in ultradeep well CT, however, presents unique problems compared with traditional wells.2 These arise from the need for longer CTs, greater depths, and resulting impacts on pressure dynamics. Ultradeep wells face higher operating pressures and temperatures, affecting nitrogen's physical properties, including density and dynamic viscosity. Precisely estimating pressure drop in CTs only from surface data becomes complex.3
This study addresses these problems using the microelement method to segment CTs. It accounts for geometric characteristics and operational conditions. Computational simulations analyze and track nitrogen pressure, temperature, and other properties in each CT segment, leading to a pressure-drop model for nitrogen lifting in ultradeep well CTs. This model aids pressure-drop analysis, operational parameter determination, and appropriate CT selection for ultradeep well applications.
Deep CT microelement analysis
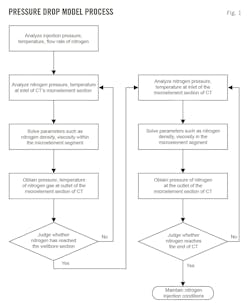
The method for establishing the pressure-drop model in the nitrogen lifting operation of ultradeep well CT first disregards local pressure losses caused by connecting components in the process before nitrogen injection into the CT. It then divides the CT into enough microelement segments that changes in nitrogen pressure and temperature in each microelement segment are relatively small. Bernoulli's equation assumes steady-state flow to describe nitrogen flow within each microelement segment. To calculate pressure-drop across the entire CT, initial conditions use injected nitrogen-displacement, pressure, and temperature to calculate flow rate, pressure, and other nitrogen parameters at the outlet of the microelement segment. These parameters become entry conditions for the next microelement segment, and so on, until the pressure drop of the entire CT is calculated.
This segmented calculation method tracks flow and nitrogen inside the CT as well as the effects of pressure and temperature. This model provides pressure drop inside the CT during nitrogen lifting operations in ultradeep wells, and important reference and guidance for determining operating parameters and optimizing the selection of CT.
According to Bernoulli's equation, total pressure drop across the microelement segment of CT depends on nitrogen density, flow rate, friction coefficient, and positive inclination angle of the microelement section within the CT. Calculating these relevant parameters involves considering two physical properties of nitrogen: dynamic viscosity and specific heat at constant pressure.
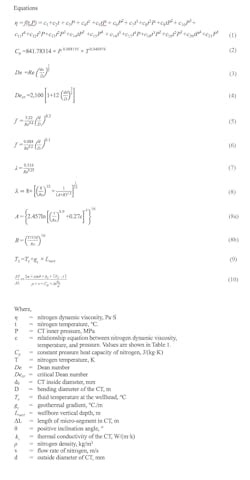
Deng et al. established a fifth-degree polynomial linking nitrogen's dynamic viscosity, temperature, and pressure (Equation 1).4 Covering 0-50 megaPascals (MPa) pressure and 0-300° C., it deviates only 0.26% from National Institute of Standards and Testing (NIST) data.
As nitrogen flows within the CT, pressure drop and friction effects lead to temperature variations. In the context of ultradeep well conditions, however, these temperature changes are minimal when compared with heat conduction along the pipe wall.5 Thus, this heat conduction represents the primary concern regarding temperature fluctuations in such operations. The constant pressure heat capacity of nitrogen addresses this issue as shown in an equation derived from the literature (Equation 2).6
CT forms either a helical shape for the surface drum section or a straight pipe for the downhole section during geometrical configurations. The lengths of these states vary with the depth of the CT, and in ultradeep operations both states have significantly longer lengths. Accurate pressure-drop calculations in the spiral state section of the surface drum, therefore, are crucial when conducting nitrogen lifting operations on ultradeep CTs.
In the surface roller section of the CT, ambient temperature influences heat conduction between nitrogen and the inner wall of the pipeline. Typically, the nitrogen outlet temperature from the nitrogen injection equipment is set based on the ambient temperature. Given the minor height difference between the nitrogen inlet and the CT end in the surface section, gravitational pressure drop can be disregarded within this section.
Srinivasan's formula calculates the friction coefficient in the ground section of the helical-shaped CT.7 Dean number (De), calculated with Equation 3, represents the flow regime, and Equation 4 calculates the critical Dean number.8 Equation 5 calculates the friction coefficient in laminar flow and Equation 6 calculates the friction coefficient in turbulent flow.
The CT on the surface section is arranged in layers around a drum, and each microelement segment may be in different layers, resulting in varying bending diameters (D). Microelement pressure drop calculations, therefore, require calculated bending diameter based on drum geometry and microsegment location within the drum.
The CT within the wellbore section is approximated as a straight pipe state. Churchill's equation [Equation 9] calculates the friction coefficient for nitrogen. Considering the transitional flow range, a turbulent state exists when Reynolds number (Re) exceeds 4,000. The relative roughness of the pipe wall, ε, is provided by the CT manufacturer. Equation 7 calculates the friction coefficient in laminar flow and Equation 8 the coefficient in turbulent flow.
Unlike the surface section of the CT, the downhole section requires calculation of the nitrogen temperature increase due to heat conduction from the tubing wall, especially in ultradeep wells. The calculation assumes that the temperatures within the wellbore and formation follow a linear distribution, while neglecting heat exchange between the wellbore fluids and the wellbore wall. Fluid temperature at surface represents the lowest boundary condition for nitrogen temperature and formation temperature represents the highest boundary condition. Equation 9 represents the temperature at any vertical depth in the wellbore (TL).
The differential equation describing the temperature distribution of nitrogen within the straight pipe section of the downhole segment of CT is summarized in Equation 10, based on the micro-element equation for temperature distribution developed by Zhang et al.10 The cyclic calculation process for the pressure-drop model of nitrogen lifting operation in the CT of ultradeep wells is outlined in Fig. 1.
Field results
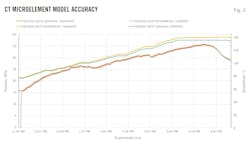
To validate the model, onsite experiments applied the model using surface construction data and compared calculated results to downhole measurements. The test well had a total drilling deviation depth of 6,088 m, vertical depth of 5,192.51 m, and a geothermal gradient of 0.0232° C./m. The operation aimed to reach a maximum injection depth of 5,200 m using a 44.45-mm outer diameter CT with WT varying between 4.0-4.8 mm. Total CT length was 6,217 m with the CT reel core having a diameter of 2,032 mm, an inner width of 1,981 mm, and CT130 steel. A CYLJA-140-175 gauge recorded downhole pressure and temperature at the end of the CT string. Recording rate was one sample/sec.
Fig. 2 shows the model’s accuracy. Experimental results revealed 1.26% average absolute percentage error for the CT's internal pressure drop and 3.52% error for temperature.
Sensitivity analysis
Sensitivity analysis was performed on six aspects of the pressure drop model: nitrogen injection pressure, nitrogen injection displacement, pressure drop inside the CT, CT wall thickness, geometric dimensions of CT drums, and temperature.
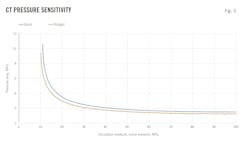
Sensitivity analysis first examined the impact of surface nitrogen injection pressure, the pressure drop inside the 44.45-mm diameter, 4.44-mm WT, and 10,000 m long CT at 30 ℃. with an injection rate of 30 cu m/min normalized at 20° C. (293.15K) and 1 atm pressure (N cu m/min) (Fig. 3). Temperature variations and gravity effects were neglected for this simulation. The results demonstrated a maximum pressure drop of 9.37 MPa for the straight pipe configuration and an increase of 35.63% for the helical configuration due to secondary flow. Both configurations exhibited a similar trend, with a sharp decline followed by a plateau of about 2 MPa. These findings provide a baseline for further sensitivity analyses with adjusted parameters.
Surface nitrogen injection displacement effects on the pressure drop were calculated inside the CT by keeping other variables constant. Simulations used nitrogen-injection pressures of 10, 20, and 30 MPa and revealed two main trends (Fig. 4): the pressure drop inside the CT gradually increases with surface nitrogen-injection displacement, and different surface nitrogen-injection pressures had corresponding flow rate boundaries beyond which the CT's internal pressure drop sharply rises.
Comparing helical and straight pipe configurations of the CT, under any fixed surface nitrogen injection pressure, the maximum achievable nitrogen flow rate difference within the CT intensified with increased pressure, magnifying the difference between the two CT states.
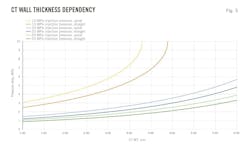
This work examined WT (or ID) effects on the pressure drop inside the CT at surface nitrogen injection pressures of 10 MPa, 20 MPa, and 30 MPa. Fig. 5 illustrates the relationship between CT pressure drop and changes in CT wall thickness. A CT with a 44.45-mm diameter and a length exceeding 10,000 m typically has an ideal WT ranging from 3.68 to 4.8 mm. Increasing WT (or decreasing ID) resulted in an increase in CT pressure drop, but the magnitude of this increase decreased as nitrogen injection pressure increased. WT had its biggest impact at a surface nitrogen injection pressure of 10 MPa.
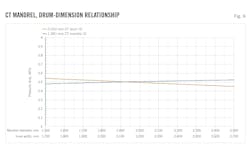
In practical CT drum selection, mandrel diameter and drum inner width often move synchronously, effectively nullifying their individual impacts on the CT's internal pressure drop. Fig. 6 illustrates how changes in drumcore-shaft diameter and inner width affect the variation in CT pressure drop. Keeping other parameters constant, this study revealed that an increase in the drumcore-shaft diameter led to a gradual reduction in the CT's internal pressure drop when the surface nitrogen injection pressure was 20 MPa. Conversely, CT pressure drop increased with a widening drum inner width. The range of diameters and drumcore-shaft inner widths matched real drum limit values, resulting in only minor impacts of CT drum geometry on its internal pressure drop.
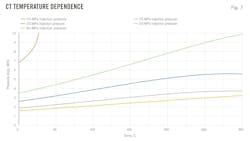
During CT operations in ultradeep wells, temperature changes in nitrogen primarily occur in the straight pipe section of the wellbore. In this analysis, the relationship between internal pressure drop and temperature in the CT is based on the straight pipe configuration. With other parameters held constant, Fig. 7 shows how CT's internal pressure drop varied with temperature for surface nitrogen injection pressures of 10, 15, 20, 30, and 40 MPa. As temperature increased, the pressure drop inside the CT generally increased. A lower surface nitrogen-injection pressure resulted in a larger temperature effect on the pressure drop within the CT.
An increase in temperature slowly reduced its impact on the CT’s internal pressure drop, most markedly at a surface nitrogen injection pressure of 20 MPa. At a temperature of 282 ℃., the CT’s internal pressure drop reversed trend and decreased.
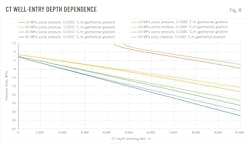
Fig. 8 shows the variation of the CT's internal pressure drop with changes in well-entry depth. Assuming a vertical wellbore, a wellhead fluid temperature of 30 ℃., and geothermal gradients of 0.0203 ℃./m and 0.0285 ℃./m, fixing nitrogen injection pressures at the surface, increasing injection depth, or increasing static liquid column pressure reduced the CT internal pressure drop nearly linearly. As surface nitrogen-injection pressure increased from to 40 MPa from 10 MPa, the slope of this pressure drop steepened. A higher well temperature also increased the CT's inner pressure drop consistently across various surface nitrogen-injection pressures.
The study is limited in data beyond a 5,200-m operational depth, hindering a comprehensive model validation. The study revealed increasing calculation errors in nitrogen temperature as operational depth and time grew. Future research should explore temperature variations in wellbores during nitrogen injection in ultradeep well CTs to enhance model accuracy.
References
- Haige Wang., Huang H.C., Bi W.X., Ji G.D., Zhou B., and Zhuo L.B., “Deep and ultra-deep oil and gas well drilling technologies: Progress and prospect,” Natural Gas Industry B, Vol. 9, No.2, April 2022, pp.141-157.
- Aitkena B., Livescua S., and Craig S., “Coiled tubing software models and field applications – A review,” 106308, Journal of Petroleum Science and Engineering. Vol.182, November 2019.
- Guoqing Han., Gaoqiang Ma., Yue Gao., He Zhang., and Kegang Ling., “A new transient model to simulate and optimize liquid unloading with coiled tubing conveyed gas lift,” 108394, Journal of Petroleum Science and Engineering, Vol. 200, May 2021.
- Deng RM. and Wang X., “Application of Coiled Tubing and Air Lifting Induced Flow Technology in Well Sam-43 in Turkmenistan,” Drilling & Production Technology, Vol.33, No.4, July 2010, pp. 122-127.
- Neog, D., Sarmah, A., and Baruah, M.I.S., “Computational analysis of coiled tubing concerns during oil well intervention in the upper Assam basin, India,” Scientific Reports, Vol.13, January 2023.
- Deng Q.G, Song P.Y., Mao W.Y., and Xu H.G., “Fitting expression of relationship gas viscosity, and temperature and/or pressure,” Journal of Drainage and Irrigation Machinery Engineering, Vol. 35, No.2, February 2017, pp. 144-148.
- Srinivasan P.S., Nandapurkar S.S., and Holland F.A., “Friction factors for coils,” Transactions of the Institution of Chemical Engineers, Vol. 48, 1970, pp.156-161.
- Dean W.R. and Hurst J. M., “Note on the motion of fluid in a curved pipe,” Philosophical Magazine, Vol.4, No.20, April 1958, pp. 208-223.
- Churchill, S. W., “Friction-Factor Equations Spans All Fluid Flow Regimes,” Chemical. Eng, Vol. 84, No. 24, 1977, pp. 91-92.
- Zhang Z., Chi M., Zhao H.Y., and Wang, M.F., “Calculation method of temperature field in concentric gas injection wellbore,” Journal of Yangtze University (Natural Science Edition), Vol.12, No. 26, September 2015, pp. 59-63.
- Chen X., Yan T., Bi, X.L., Luan S.Z., Li Y., and Du, J.Y., “Calculation method for internal frictional pressure drop in coiled tubing and analysis of sensitivity,” Oil Drilling & Production Technology, Vol. 36, No. 5, September 2014, pp.13-15.
Authors
Fujun Fang ([email protected]) is a senior engineer at China National Petroleum Corp. (CNPC) and leader of the Fang Fujun Skill Expert Studio at CNPC Chuanqing Drilling Engineering Co. Ltd., Chengdu, China. He holds a BS (2000) from the University of Electronic Science and Technology.
Jianqiu Li ([email protected]) is an engineer at CNPC Chuangqing Drilling Engineering Co., Ltd., Chengdu, China. He holds a BS (1994) from Southwest Petroleum University of China.
Xiaozhi Shi ([email protected]) is a senior expert at CNPC Chuanqing Drilling Engineering Co., Ltd., Chengdu, China. He holds an MS (2011) from Southwest Petroleum University of China.
Youbin Chen ([email protected]) is the director at the Engineering and Technology Department at CNPC Chuanqing Drilling Engineering Co., Ltd., Chengdu, China. He holds a BS (2006) from China University of Petroleum.
Zhiyao Liu ([email protected]) is a Deputy Director at the Shale Gas Engineering Technology Center of China Petroleum Corp., Chengdu, China. He holds a BS (2012) from Southwest Petroleum University of China.
Yuanyuan Li ([email protected]) is a Deputy Director at the Shale Gas Engineering Technology Center of China Petroleum Corp. She holds an MS (2008) from Southwest Petroleum University of China.
Xiude Lu ([email protected]) is a Deputy Chief Engineer at CNPC Chuangqing Drilling Engineering Co. Ltd., Chengdu, China. He holds a BS (2000) from Daqing Petroleum Institute in China.
