Hybrid approach to risk management

USING MODERN PORTFOLIO THEORY AND VAR TO DRIVE PROACTIVE RISK-ENGINEERING
PATRICK NG, REAL CORE ENERGY, HOUSTON
IN AN EARLIER ARTICLE (July 2016 OGFJ), we demonstrated how a hybrid approach combining bottom-up well modeling and top-down portfolio simulation could drive prudent decision-making. In this article, we adapt the hybrid approach to derive value-at-risk (VaR), a measure of the risk of investment used by financial firms and regulators, for oil and gas. Using examples from South Texas, we demonstrate how the practical application of hybrid VaR can drive risk management.
FUNDAMENTAL - RETURN SENSITIVITY
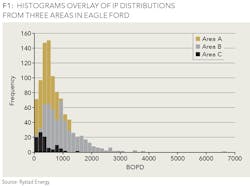
In Figure 1, we show the practical, 30-day average initial production (IP) distribution of three assets in the Eagle Ford shale play. Note the IPs are not normal bell curves, and returns distribution will be skewed. Using the average IP will yield overly optimistic break-even analysis (e.g., comment on Bakken by Leonardo Maugeri, Unconventional Oil and Gas Report, January-February 2015).
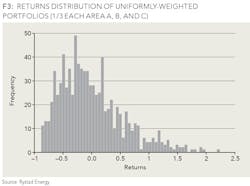
Next we proceed to model the returns using the same computation engine as for the hybrid approach. The return distributions for a single asset in area A and uniformly-weighted portfolio (1/3 each) of the three assets are shown in Figures 2 and 3, respectively.
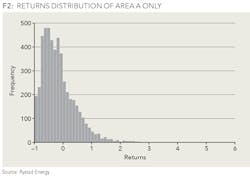
Figure 3 shows the returns distribution of uniformly-weighted portfolio (1/3 each area A, B, and C). Note the returns range is much compressed versus that of Figure 2. (Source: Rystad Energy.)
Returns distribution (histogram) depends on the portfolio weights. Different mix, different shape.
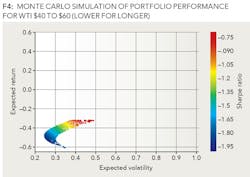
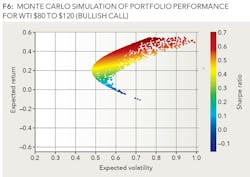
FACTOR ANALYSIS - PORTFOLIO RETURN SENSITIVITY TO WEST TEXAS INTERMEDIATE (WTI)
What we are really after is how a portfolio performs over the next 15 to 18 months under different WTI scenarios.
VALUE-AT-RISK (VAR) APPLICATION
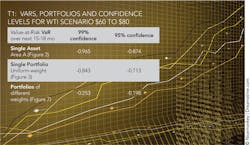
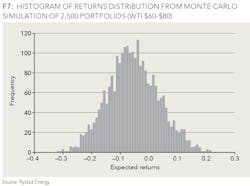
Starting with our return distribution generated earlier, sort the computed returns from the lowest to highest. Finally, for VaR at 99% confidence, simply look up the worst 1% of return. For 95% confidence, the worst 5% of return. Table 1 summarizes the VaRs for mid-range WTI scenario.
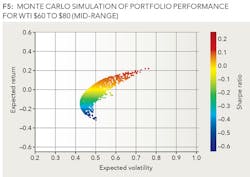
Figure 7 is a histogram of returns distribution from Monte Carlo simulation of 2,500 portfolios (Source: Rystad Energy).
INTERPRETATION
Think of: a) single asset as a highly concentrated portfolio dominated by one asset, b) uniform-weight portfolio a simple diversification spreading our bet in different areas, and c) Monte Carlo simulation of thousands of portfolios as a broad index or a loan portfolio, holding different mix of assets across different areas. Measured by VaR, diversification does reduce the downside risk.
VAR ACTIONable Insights
VaR provides a key quantifiable input to risk-engineering metric. Take the uniform-weight portfolio of 1/3 each of assets A, B, and C as example. Table 1 shows VaR at 99% confidence level of -0.843, meaning we may lose 84.3% or more of invested capital over the next 15 to 18 months, 1% of the time. Likewise, VaR at 95% of -0.713 suggests 71.3% or greater loss over the same period, 5% of the time. For a notional portfolio investment of $ 800 million, the VaR will be $ 674.4 and $ 572 million, respectively.
Hybrid VaR approach enables an organization to quickly transform production data, proactively quantify risk and evaluate what it takes, financially and operationally, to manage the downside (e.g., multiple of VaR as contingency resources, hedging ratio, reserve capital). Hence the actionable insights we gain from the VaR process is more powerful than the number itself.
SUMMARY
Why didn't we see it coming? Often a call for action after oil prices plunge. Instead of explaining after the fact, we should take a proactive approach to better quantify risk exposure and manage the downside of WTI volatility. Answer what-if through modeling rigor and simulation transparency.
Beware of the black swan. While VaR is a powerful measure of risk in a single number, it does not predict the size of the maximum loss in a catastrophic event. On the other hand, once computation of VaR is implemented as practical risk management, we can test drive monthly, even weekly or daily, during times of high WTI volatility or whenever new data is made available.
Instead of looking at the rear-view mirror, the hybrid VaR approach is forward-looking design coupled modeling with simulation. It helps quantify risk exposure and stress test portfolios over a multitude of WTI scenarios. With actionable insights gained, develop more robust hedging strategy and portfolio optimization. In practice, hybrid VaR helps operators develop financially and operationally sound contingency plan, thrive in "lower for longer" and win on rebound.
ABOUT THE AUTHOR

Patrick Ng ([email protected]) is a partner at Real Core Energy in Houston. He has a focus on acquisitions and divestitures. He held operations and technology leadership positions at WesternGeco and Fugro, developing and bringing solutions to market at the intersection of data and technology.
ACKNOWLEDGEMENT
We thank Andrew Conacher of Rystad Energy for providing the data to perform the ROI model calibration and VaR analysis.