Operating profitably with $50 oil
A HYBRID APPROACH PAVES THE WAY TO FINANCIAL SAVVY
PATRICK NG, REAL CORE ENERGY, HOUSTON
GEOFFREY WONG, IAM LEGACY, HONG KONG
OVER THE PAST FEW MONTHS, much has been written on rethinking capital and resource allocation to operate profitably at $50 oil. The former president of the Society of Petroleum Engineers has coined the term FIT@50, that emphasizes both operational excellence (e.g., cost control, equipment standardization, and technology innovation) and financial savvy (i.e., portfolio adjustment and risk management). "Thinking through the downturn" (OGFJ, July 2016) has further raised the bar and put the challenge at $40.
In a previous article (OGFJ, October 2016), we have adapted the hybrid approach combining bottom-up well modeling and top-down portfolio simulation, to derive value-at-risk (VaR) for oil and gas. Post financial crisis, many authors note that a VaR model built on normal returns distribution has significant pitfalls, especially over heavy tail losses.
Mindful of pitfalls, we derive intrinsic VaR directly from oil and gas production data (not theoretical returns distribution). Using data examples from South Texas, we illustrate how a hybrid approach paves the way to financial savvy seeking-alpha portfolio and managing risk.
AUTHENTICITY OF INTRINSIC VALUE-AT-RISK
Investopia.com offers a compact visual explanation. In essence, the three methods to estimate VaR are: 1) historical –generate histogram of returns and pick the worst returns as VaR at desired confidence level (e.g., return of histogram at 5% as 95% confidence level); 2) mean-variance – estimate mean and variance (i.e., standard deviation squared) from historical returns and look up VaR assuming returns behave like a normal distribution or bell curve; 3) Monte Carlo simulation – generate returns from multiple trials, sort returns and pick VaR as in historical method.
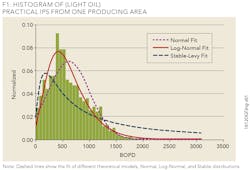
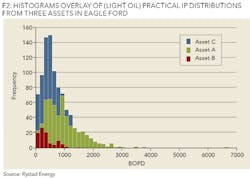
Figure 1 compares practical initial production (IP) from the Eagle Ford shale in South Texas with different theoretical distribution models. While stable distribution is favored by financial engineers because of its versatility, it suffices to note that no single theoretical model matches the actual data adequately, nor generalizes very well. Hence the case for authenticity. We use oil and gas production data (Figure 2) and bottom-up well economics model to derive returns and drive intrinsic VaR.
Bottom Line: If the underlying return distribution is close to being normal, all three methods perform well. While the mean-variance method serves as benchmark, its estimated VaR falls short when the underlying return distribution is not a bell curve. In contrast, hybrid intrinsic VaR lets the data speak and captures well productivity jumps from innovative practice over time.
EQUILATERAL PORTFOLIO
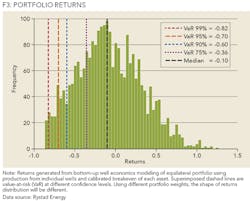
As a learning process, we assign equal portfolio weights to the three assets (1/3 each) and a West Texas Intermediate (WTI) mid-range scenario (i.e., $60 to $80 oil over next 15 to 18 months). Convert prac IPs into returns (Figure 3) using calibrated well economics model, sort returns into histogram, and pick out VaR at different confidence levels.
POSSIBILITY OF bREAKTHROUGH
Hybrid is unique in two aspects: 1) authenticity—drill down to individual wells and use actual oil and gas production data without assuming the distribution of underlying returns to estimate the intrinsic portfolio VaR, and 2) transparency—model enables practitioners to conduct systematically what-if factor analysis.
Most important of all, as a -learning tool, hybrid helps us develop deeper insights into risk-return sensitivity with respect to WTI swings, acreage quality, operating efficiency, and technology innovation, individually and in combination.
As an iterative process, the hybrid approach also facilitates communication within an organization connecting strategy to execution. With the ability to interact with financial, operational and technical data, hybrid approach helps organizations break down silos. Bring together stakeholders to solve a complex problem collaboratively and focus on return naturally.
SEEKING ALPHA PORTFOLIO
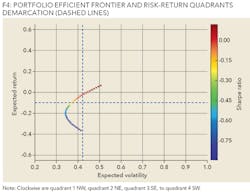
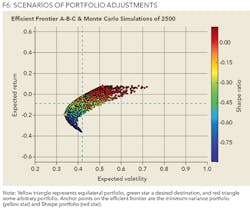
Hybrid approach paves the way to seeking alpha portfolio and hedging strategy. First, we partition the return-volatility space into four quadrants (Figure 4) and display the efficient frontier (e.g., at desired return, unique set of weights that minimizes portfolio volatility). Think of it as the envelope or outer boundary of all possible portfolios with different sets of weights.
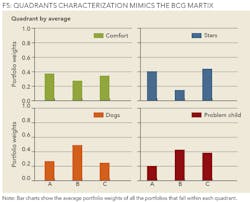
Next, we perform Monte Carlo simulation of all possible portfolios track their return and volatility. Like astronomers scanning the night sky for distant galaxies and black holes, we extract the "galactic center of gravity" by taking average portfolio weights with each quadrant (Figure 5). To make the quadrant labels memorable, we mimic the BCG portfolio matrix.
Interpretation: Note the inverse relation among the diagonal quadrants in Figure 5. Quadrant 2 (Stars) delivers higher risk-adjusted return; quadrant 3 (Problem Child) compromises value with lower return at higher volatility. The Stars portfolio's return and volatility position is the green star in Figure 6 and a good destination for portfolio adjustment.
Seeking-alpha portfolio here means capturing extra risk-adjusted return. Imagine return-volatility surface as the chessboard partitioned into many small tiles (beyond four quadrants), and implement hybrid portfolio weights adjustment from any starting point to any destination of higher risk-adjusted return (Figure 6). In action, move from yellow triangle (equilateral portfolio of equal weights) to the green star, and adjust portfolio weights from (1/3, 1/3, 1/3) to (0.41, 0.149, 0.441). Another alpha-seeking move from the red triangle to green star increases return at identical volatility. In both scenarios, the Sharpe ratio increases.
MANAGING DOWNSIDE RISK
Because VaR figures are relatively straight-forward to compute, they serve as a convenient means to quantify and make sense of a distressed situation. As a reality check, we have normalized hybrid VaRs from our South Texas equilateral portfolio to daily VaR (Table 1). They are comparable to that of a diversified investment portfolio that spans multiple asset classes of bonds, equities, and emerging markets.
Financial Assets: Take the second row as an example. On average, there is a 5% chance that the portfolio would lose at least 3.42% on a particular day. In other words, on average, once every 20 days the portfolio would suffer a daily loss of at least 3.42%. When a loss reaches or exceeds a given threshold, a "VaR break" occurs. Armed with this statistical information, an asset management firm needs to ensure that it is prepared to handle the fallout of a VaR break. A low-probability distressed event will probably trigger failures with some market participants, which will increase the counterparty risks significantly for everyone else. Therefore, a portfolio manager has to regularly review individual positions (especially derivatives) within the portfolio and be comfortable with, and ensure the capability to withstand, the potential counterparty risk.
Oil and Gas Producing Assets: The time horizon for an operator is different. While we won't be liquidating producing assets at the click of a mouse on a daily basis, the notion of VaR break is useful. For example, an organization with a strong balance sheet and a healthy risk tolerance may choose to hedge at VaR break of 75% confidence level (Figure 3), whereas a more risk-averse player may opt to hedge at VaR 90%.
CONCLUSION
Why hybrid? Anchored on oil and gas production data, 1) hybrid portfolio - highly scalable across plays (OGFJ July 2016 ) as well as within a field at the asset level; 2) intrinsic VaR - free from the pitfalls of normality assumption and limitations of theoretical distributions. Benchmark core acreage, simulate what-if scenarios and aggregate portfolio returns seamlessly. Transform production data into actionable prescriptive analytics.
With authenticity and transparency, insights gained in the process of deriving portfolio weights and intrinsic VaRs will become more valuable than the numbers themselves. The more scenarios we work the relative allocation weights and visualize the impact on risk-return dynamics, the better we develop robust strategy and adapt to changes.
To hedge or not to hedge? With hybrid, the journey ahead is less a challenge and more an opportunity to learn and manage risks and develop a financially and operationally savvy priming portfolio and hedging strategy into a durable competitive advantage.
The combination of hybrid portfolio and intrinsic VaR modeling makes a powerful duo for opportunistic acquisitions and divestitures and managing the downside risk. Hybrid closes the loop in seeking alpha and connects strategy to execution.
ACKNOWLEDGEMENT
We thank Andrew Conacher of Rystad Energy for providing the data used in model calibration and VaR analysis.
ABOUT THE AUTHORS
Patrick Ng ([email protected]) is a partner at Real Core Energy in Houston. Ng has a focus on acquisitions and divestitures. He held operations and technology leadership positions at WesternGeco and Fugro, developing and bringing solutions to market at the intersection of data and technology. He earned his MS in Geology and Geophysics from Yale University and MBA from University of Houston.
Geoffrey Wong, CFA ([email protected]) is a portfolio manager at IAM Legacy, a family office in Hong Kong. He has worked previously as an analyst and a portfolio manager for several major financial institutions and boutique investment banks in New York, London, and Hong Kong. He received a BA from University of California, Berkeley and an MEng from Cornell University.
