North American Shale
PRODUCTION CONTINUES TO GROW, ALBEIT AT A SLOWER PACE
PER MAGNUS NYSVEEN AND LESLIE WEI, RYSTAD ENERGY
In 2014, E&P companies invested approximately US$155 billion in North American shale upstream activity and produced an average of 13.1 MMboe/d. This year companies have sharply cut the shale investment budgets and the total shale expenditure is expected to be US$$100 billion, down from our previous quarter's estimate of US$135 billion. As explained in previous editions, shale is the most flexible source of production. In response to lower prices, operators can quickly drop rig counts, shift focus to core areas, and delay the completion of wells.
Average 2015 shale production is expected to be 15 MMboe/d, slightly down from the fourth quarter estimate of 15.3 MMboe/d. Figure 1 shows the month-by-month light oil production in the US with the forecast split by the life cycle of the well. 'Drilled, not yet producing' represents the production from wells drilled but not completed. 'Not yet drilled' consists of the production coming from wells expected to be drilled based on company reported activity. The historical numbers are from official reports and the forecast is estimated well by well with assumed hyperbolic type curves. In addition to the natural decline from producing wells, the chart shows that most of the production growth for the year will come from wells already drilled, i.e. if operators stopped all drilling activity as of April 2015, there will still be a positive production growth rate for the year.
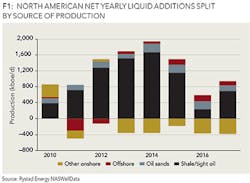
The North American supply picture has changed drastically over the last five years. Prior to 2010, decreasing conventional production was the primary driver for flat liquid production. Since then, shale/tight oil has been increasing liquid additions each year. Figure 2 shows the year by year net liquid additions for North America split by the different sources of production. Net additions from shale/tight oil are expected to fall for the first time in 2015 dropping from 1.7 MMboe/d in 2014 to 1.2 MMboe/d in 2015. The decrease in 2015 shale activity will have a larger impact on the 2016 production levels, dropping net additions to 0.24 MMboe/d. Supply and demand outlook indicates that shale investments will pick up in 2016, resulting in higher 2017 production rates.
Table 1 shows the 2015 production and spending forecast broken down to the main shale plays. In 2015 companies are cutting spending across all plays in response to low oil prices. Meanwhile, production will continue to grow, albeit at a slower pace compared to previous years. The production growth rate varies from play to play but it is expected to be higher for emergiang plays since there are fewer legacy wells contributing to the decline. Overall, production rates will remain robust for at least the first three quarters of 2015, with most of the spending effects being felt in 2016.
ABOUT THE AUTHORS
Per Magnus Nysveen is senior partner and head of analysis for Rystad Energy. He joined the company in 2004. He is responsible for valuation analysis of unconventional activities and is in charge of North American shale analysis. Nysveen has developed comprehensive models for production profile estimations and financial modeling for oil and gas fields. He has 20 years of experience within risk management and financial analysis, primarily from DNV. He holds an MSc degree from the Norwegian University of Science and Technology and an MBA from INSEAD in France.
Leslie Wei is an analyst at Rystad Energy. Her main responsibility is analysis of unconventional activities in North America. She holds an MA in economics from the UC Santa Barbara and a BA in economics from the Pennsylvania State University.


