Unconventional resources
COST DEFLATION AND THE EFFECT ON 2015 BREAKEVEN PRICES
PER MAGNUS NYSVEEN AND LESLIE WEI, RYSTAD ENERGY
AS THE OIL PRICE REMAINS low exiting the first half of 2015, operators are emphasizing the lower unit costs, or cost deflation, expected for the year. Lower costs are the combined effect of two reduction categories: efficiency gains (structural) and lower service costs (cyclical). Both points are important when estimating 2015 breakeven prices.
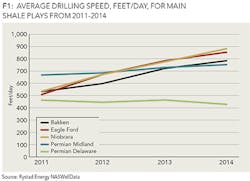
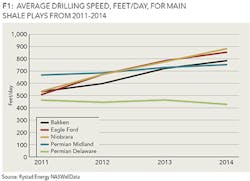
Since operators started drilling unconventional wells in the early 2000s, rigs have been getting more efficient. To illustrate this, Figure 1 shows the drilling speed of a typical rig, measured as feet drilled per day, for the main shale plays. Drilling speed has increased across most plays, especially the Bakken, the Niobrara and the Eagle Ford, where the average rig was able to drill 30% faster in 2014 than in 2012. The only play that shows a slight decrease in the drilling speed is the Permian Delaware, where the checkerboard leasing structure of the play makes it difficult for operators to drill from pads (See Permian Basin update, OGFJ, January 2015).
REDUCTION IN SERVICE COSTS
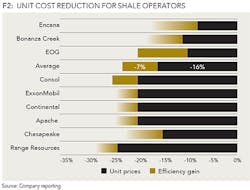
The second cost deflation category is the reduction in service costs. As low oil prices persist, there has been a 50% drop in US land rigs from December 2014 to June 2015. To remain in business, service companies must squeeze their margins and reduce costs. Figure 2 shows the unit cost reduction in the US as reported for 10 exploration and production companies. Companies are reporting an average cost reduction of 23%, where 16% of the reduction comes from lower unit prices and the remaining 7% reduction comes from additional efficiency gains. Going forward, the price reduction from efficiency gains will last, while the price reduction from service fees will gradually return to its original level.
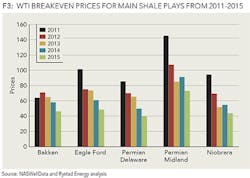
The overall lower unit costs can be used to estimate the breakeven price for wells drilled in 2015, assuming a 1% reduction in price equals a 1% reduction in the breakeven price. Figure 3 shows the breakeven prices for the main plays and how they have developed from 2011 to 2015. Historical values are calculated looking at decline curves, production mix and well cost for each year, and the 2015 values estimated, assuming a 23% decrease in prices.
On average, breakeven prices for the main oil plays have decreased ~50% since 2011. This is because operators are able to produce more as they find sweet spots, and rigs are able to drill more as rig companies better understand shale characteristics. This year, the Bakken, the Eagle Ford, the Permian Delaware and the Niobrara are all expected to have average prices less than 50 $/bbl, where the best areas are even lower. The current breakeven price of shale and the steady trend proves that shale is a very competitive source of production, and going forward, when prices recover, operators will increase rig counts just as quickly as they dropped them.
ABOUT THE AUTHORS
Per Magnus Nysveen is senior partner and head of analysis for Rystad Energy. He joined the company in 2004. He is responsible for valuation analysis of unconventional activities and is in charge of North American shale analysis. Nysveen has developed comprehensive models for production profile estimations and financial modeling for oil and gas fields. He has 20 years of experience within risk management and financial analysis, primarily from DNV. He holds an MSc degree from the Norwegian University of Science and Technology and an MBA from INSEAD in France.
Leslie Wei is an analyst at Rystad Energy. Her main responsibility is analysis of unconventional activities in North America. She holds an MA in economics from the UC Santa Barbara and a BA in economics from the Pennsylvania State University.


