Exploration & Production
Upstream valuations in the current commodity price environment
SEENU AKUNURI, TIM STUHLREYER, BRIAN LI, GIONA VODO, PWC, HOUSTON
THE OIL AND GAS SECTOR continues to remain a volatile environment. There was some optimism in the market at the end of 2016 and early 2017 following deals in the Permian and other US shale regions, as well as an increase in the number of oil and gas companies restructuring and emerging from bankruptcy. However, despite OPEC and others curbing production, there seems to be no near-term balance of supply and demand. Yet the extreme reaction by oil and gas companies to lower commodity prices could result in a severe shortage of supply in future years. During 2015 and 2016, upstream companies reduced their capital budgets from an estimated $760 billion in 2014 down to $600 billion in 2015 and $438 billion in 2016 (Wood Mackenzie). These reductions did not have an immediate impact on prices, but there was a small increase after OPEC decided to cut production from record highs in November 2016. Further, in May 2017, OPEC agreed to extend production cuts until the end of the first quarter of 2018. However, these temporary cuts do not reflect the long-term impact of the capital budget reductions, which is illustrated better in long-term supply demand comparisons. In 2018 global demand is expected to exceed supply, a likely result of the response to lower commodity prices beginning in late 2014. This article is an update to PwC's "Upstream Valuations in the Current Environment" article published in OGFJ's February 2016 issue and examines changes and continuations in trends and analyzes key inputs and assumptions utilized in company and asset valuations in the current oil and gas environment.
Oil and gas price performance and market capitalization
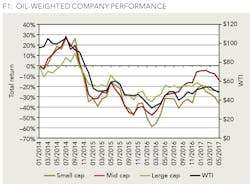
Figure 1 shows the relative performance of publicly traded E&P oil-weighted company indices and the correlation to WTI spot crude oil. Mid-cap companies (between $2B and $10B in market cap) have performed best overall, particularly during late 2016 and early 2017. Several energy companies have recently emerged from bankruptcy. With that being said, there is still no clear consensus on the expected recovery, though both oil and gas prices have been relatively stable for some time now.
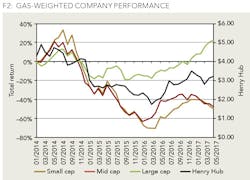
Figure 2 shows the relative performance since the beginning of 2014 of the Henry Hub spot natural gas price together with gas-weighted small-, mid- and large-cap publicly traded E&P stock indices. Unlike the oil-weighted indices, large-cap companies have done the best overall, even providing positive returns to investors since the beginning of 2014, though still relatively flat from Henry Hub's peak in mid-2014.
Valuation multiples
As shown in Figure 3, E&P valuation multiples increased from 2010 through 2013 as strong commodity pricing bolstered oil and gas valuations. These multiples declined in 2014 through 2016 as prices weakened. A contributing factor to these declines is that companies have become less willing to pay for unproved reserves given the uncertainty regarding future prices. Daily production multiples have declined more than proved reserve multiples, as producers remain reluctant to curb production even amidst falling prices and valuations.
Supply & Demand
It seems that supply is more elastic now due to unconventional shale production; supply can react to price movement more quickly inhibiting the ability to maintain extended oil price rallies.
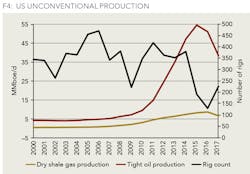
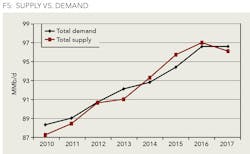
Figure 4 shows the total shale production since 2000 along with the rig count. The rapid rise of horizontal drilling has given the US the ability to add to global supply, thus contributing to the worldwide surplus of oil in 2014, 2015, and 2016 as shown in Figure 5. With the cut in oil production by OPEC in November 2016 and its extension in May 2017, demand has outpaced supply so far in 2017 for the first time in four years. However, Figure 4 shows an uptick in the rig count in 2017 given the higher oil prices which could lead to production growth in the US. Expansion of both on-and-offshore commodity storage has enabled producers to continue operations, further increasing supply.
On the cost side, technical innovation as well as reduction in production costs have led to increased industry efficiencies. Significant margin improvement has occurred under the current low-price environment and is a result of:
• Technological advances (efficiencies related to cost, time, and productivity);
• Decline in service costs;
• Greater focus on sweet spots and deploying marginal cost assets; and
• G&A and workforce reduction.
Exploration & Production company and asset valuation basics
Next, we briefly review the fundamentals of valuing individual E&P assets and privately held E&P companies and examine recent trends seen in valuation inputs and assumptions.
Methodology
The data presented was sourced from PwC clients operating in the E&P industry during 2016. The population included a variety of publicly traded and private businesses, ranging in size, location, type of play (conventional vs. unconventional) and financial strategy (corporate vs. private equity). Figure 6 shows the breakdown of companies surveyed by size.
Recent income approach trends
The income approach is generally the most commonly used method of valuing E&P companies and assets. Market approach indications of value provide some insights and corroboration for other methods. However, in an E&P context it is typically not as supportable as an income approach analysis because of significant differences from one company to another in such aspects as asset profiles, proved vs unproved reserves, current production, and pricing differentials.
The results of our study indicated that within the income approach analyses performed on E&P companies and upstream assets for 2016, some of the assumptions applied are continuations from last year while others differed from the previous year.
Use of strip pricing as the basis of their commodity pricing forecasts
Our 2015 data showed that approximately 80% of valuations surveyed utilized NYMEX strip. Our 2016 data showed an even greater trend in this selection of pricing, with almost 90% of valuations surveyed now using NYMEX as a basis for commodity pricing. Use of one or a few analysts has historically led to inaccurate pricing predications. On the other hand, strip price is directly based on companies' hedging and trading activities and it is also used as the basis for many company production forecasts.
Long-term pricing beyond strip is based on expectations of long-term inflation
Our 2016 data showed that companies used a mix of three year and five-year strip pricing. After that, long-term inflation ranged from zero to ten percent and was reflective of that company's internal, long-term forecasted oil price.
Decrease in median discount rate given increase in stability in the commodity price environment and lower cost of debt
A vast majority of companies utilized a weighted average cost of capital (WACC) as the basis for their discount rate. The range of discount rates varied widely, from a low of 6.6% to a high of 24.0%. The average WACC decreased from approximately 11.1% in 2015 to 10.5% in 2016. This is likely a result of lower cost of debt as well as a more industry appropriate debt to equity ratio, which is a big component in calculating equity betas. Figure 7 shows the yield to maturity on corporate bonds for various indices of energy companies from 2014 to 2016. Yield to maturities have decreased substantially from 2015 to 2016, particularly for the B-rated bonds which included a significant number of the E&P companies in the study.
Lower risking for all non-producing reserves compared to 2015
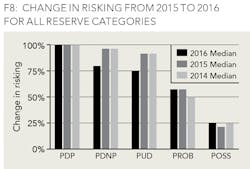
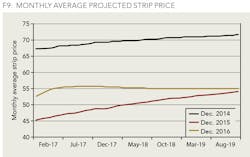
The median risking for proved developed non-producing (PDNP) reserves was 80% in 2016 compared to a median risking for PDNPs of 95% in 2015. The median risking for proved undeveloped (PUD) reserves was 75% in 2016 compared to a median risking for PUDs of 90% in 2015. Figure 8 shows the change in risking from 2015 to 2016 for all reserve categories.These changes likely reflect a heightened sense of caution among clients due to the low-price environment. Figure 9 shows the average projected strip price for the month of December for 2014 through 2016. Companies, particularly smaller ones, may not have capital resources to explore and produce all reserves.
However, the definition of proved reserves, as set forth by the SEC in Rule 4-10 of Regulation S-X, implies that the average risking of the overall proved reserve category should not be less than 90%. Therefore, this risking trend is important to monitor going forward.
Approximately 20% of E&P valuations included corporate G&A
In 2015, 57% of companies included corporate G&A expenses in their income approach, but in 2016, only 17% included it. This reflects several ongoing trends in the industry. First, for many acquirers, the expectation is that the additional assets would be handled with current G&A and would not contribute to additional G&A expenses. Second, due to the low-price environment that many small- and mid-cap E&P companies operate in, companies have focused on cutting costs and prioritized cash conservation.
However, no company can operate indefinitely without any corporate G&A. Therefore, this G&A trend is important to monitor going forward, and we would expect to see more companies include G&A going forward.
Key considerations surrounding the industry
Key ongoing considerations which will have an impact on E&P valuations include the impact of OPEC's actions, the impact of additional volumes contributed by Iran, and whether demand will increase enough to absorb current levels of production and have a meaningful impact on current storage volumes.
Additionally, the recent presidential election and associated political uncertainty may dramatically affect the operating environment for E&P companies as well as the capital markets.
Conclusion
Since the downturn in commodity prices in 2014, E&P asset and company valuations have likewise seen significant declines. While there are some positives, including greater demand than supply in 2017 as well as an increase in rig count, valuations continue to be depressed. This study on E&P company valuations reflects changes to many assumptions as part of the continued depression. Additionally, under the current market environment, E&P companies can expect greater scrutiny to be applied to valuation analyses and their inputs and assumptions. It is imperative that E&P companies continue to use key assumptions which are both auditable and based on market support.
ABOUT THE AUTHORS
Seenu Akunuri is a Principal in PwC's Deals practice in Houston, Texas. He is the leader of PwC's US Energy and Mining Valuation practice and has 20 years of experience in the valuation of businesses. Akunati holds an MBA with a concentration in Finance and Accounting from Tulane University.
Tim Stuhlreyer is a director in PwC's Transaction Services Valuation practice and has more than 10 years of experience in the valuation of businesses and intangible assets. He holds an MBA from the University of Texas and a BS in Industrial Engineering from Texas A&M University.
Brian Li is a senior associate in PwC's Transaction Services Valuation practice, specializing in the appraisal of businesses and providing corporate finance consulting services. He holds a degree in Accounting from The University of Texas at Austin.
Giona Vodo is an associate in PwC's Transaction Services Valuation practice, specializing in the appraisal of businesses and providing corporate finance consulting services. She holds a degree in Finance with a focus on the Oil and Gas industry from the University of Houston.


