Billions of dollars of bad oil and gas loans
LAURA FREEMAN, LAURA FREEMAN CONSULTING, HOUSTON
IN HIS BOOK, the Big Rich, Bryan Burrough recounts a conversation when the legendary Texas oil man Clint Murchison was in the middle of the Great Depression with debt ballooning to over $4 million, far more than his net worth. "Aren't you concerned about owing all this money you can't pay? Ernest Closuit asked him. "No," Murchison said with a smile. "If you're gonna owe money, owe more than you can pay, then the people can't afford to foreclose."
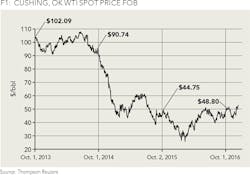
One of the main lending sources in oil and gas is a Reserves-Based Loan (RBL). This loan is a line of credit generally extended by a syndicate of banks collateralized or backed by a company's oil and gas reserves. In the simplest form, oil reserve value is the cash flow from future expected production times the price of oil. These cash flows are then discounted back to give a net present value, often PV10. The amount of collateral the loan is based on is called the borrowing base, which in its simplest form is the reserves PV10 times a risk factor times an advance rate. The risk rate for proved producing (PDP) wells on production is often around 95% and proved undeveloped (PUD) or new drill locations 50%. The advance rate for how much value can be used as collateral is often 65%. Traditionally, a company will have its borrowing base reviewed twice a year-in the Spring and Fall-to set the amount or credit line available on the loan. These loan values are fundamentally a percentage of PV of the production times the price. However, despite a 75% contraction in oil prices from 2014 to 2016 (see Figure 1) many of these loans were not reduced in 2015, 2016, or 2017. To many of us, this math just doesn't work.
Let's look at a hypothetical company modeled after a real one and follow what should have happened to its borrowing base in the Fall redeterminations from 2014 to 2016. The company, Murch Co. (after Murchison), has proved producing (PDP) and proved undeveloped (PUD) reserves. It has 25% of its reserves on the books as PUD (% PV). For simplicity, let's assume the company is not hedged, has no proved non-producing (PDNP) reserves, and only produces oil (no gas or liquids).
Summary of Murch Co.'s reserves and indicators Oct 1, 2014:
• Producing gross 44,090 BOEPD
• 100% WI, 75% NRI
• From 10-K Production: Year 1 30% decline, Year 2 20% decline, and 10% afterwards
• $5.90/BOE production plus G&A costs
• 5-year PUD program:
• 6 unconventional wells a year, IP=650 BOPD oil, 79% Di, B=1.2, 6% Dmin
• $7MM D&C, $10,000/well/month OpEx
• 18 conventional wells a year, IP=65 BOPD, 8% decline
• $1.8MM D&C, $2,800/well/month OpEx
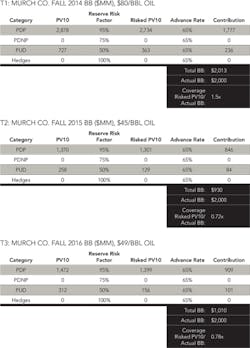
In the Fall of 2014, Murch Co. had a borrowing base redetermination using an $80/bbl price deck (average for an actual bank deck at that redetermination). The PV for the reserves was calculated in Aries or PhDWin (industry standard reserves economics software). As shown in Table 1, the borrowing base was $2.013 billion, supporting the company's $2 billion facility and exceeding the required 1.4x risked PV10/BB coverage by lender agreement.
One year later, for the October 1, 2015 redetermination, the PDP base continued on its decline but added production from the 24 wells drilled. Also, assume the PUDs were replenished with a new set in Year 5. The oil price is now $45/bbl. As shown in Table 2, the borrowing base should have contracted over 50% to $0.930 billion with a coverage of 0.72x, or less than 1:1, and much less than the agreement required 1.4x.
Going one more year to the October 2016 redetermination, the same methodology was used for moving new drills into PDP and replenishing PUDs, and the oil price was increased to $49/bbl. The borrowing base is $1.010 billion and the coverage is still less than 1x at only 0.78x (Table 3).
As you can see, the Murch Co. RBL should have gone uncollateralized in 2015 and seen a contraction of over 50% from 2014 levels due to the impact of prices collapsing by about 50%. There would have been a slight increase in 2016, but not near enough for coverage with borrowing base levels still only half of what they were in 2014. For many companies, the borrowing base would be even lower as many of their unconventional PUDs went uneconomic well above $50/bbl and would have gone to $0 contribution to the borrowing base.
But many companies didn't see any contractions at all. What happened?
Probably several things. The price went so far so fast that lenders didn't unload assets, leaving them with loans with less than half the collateral value they had. In general, lenders couldn't take over and actually act as oil and gas operators for the properties, and a sale would have meant huge losses - in the words of Clint Murchison, they couldn't afford to foreclose.
In the first line of defense in 2015, several things were done to increase reserves values (and corresponding borrowing bases) even through, in many cases, the assets didn't change. These include:
• Increasing PDP reserves through lower decline rates and longer well lives
• Increasing PUD EURs through B-factor and Dmin adjustments
• Increasing PUD EURs claiming higher IPs
• Adding more PUDs
• Lowering D&C costs
• Lowering OpEx
• Adding more wells to the collateral (although many companies were at 80% or more in 2014)
Some of these changes may be justified, but, in many cases, reserves values were already inflated as borrowers levered up with the ultra-low interest rates to boost returns and fund the large unconventional programs prior to 2014.
For many companies, if not all, the changes weren't enough to cover billions of dollars in gaps, but borrowing bases still didn't contract. What happened?
Lenders changed the rules.
Let's look at the April 2016 changes to Chesapeake's (CHK) agreement. Chesapeake has kept a $4 billion borrowing base since 2014. However, as seen in the Murch Co. example, it is most likely no longer collateralized per the original lending agreements. In the Spring 2016 redetermination, the lenders decided to address this not by pulling back on the credit line or by foreclosing on assets, but by skipping a year of review and changing the requirements on being "collateralized." Specifically, from Chesapeake's website:
"The next scheduled borrowing base redetermination review has been postponed, and the lenders have agreed not to exercise their interim redetermination right, in each case until June 2017.
The amendment provides temporary covenant relief, with the facility's senior secured leverage ratio suspended until September 2017, then reverting to 3.5x through December 2017 and decreasing to 3.0x thereafter.
The amendment reduces the interest coverage ratio to 0.65x from 1.1x through March 2017, after which it will increase to 0.70x through June 2017, then reverting to 1.2x in September 2017 and to 1.25x thereafter."
In plain terms, in 2016 Chesapeake no longer had sufficient collateral to back its loans and probably hadn't since the end of 201, but the losses associated with foreclosing were so high that the lenders cut the interest rate coverage in half and to less than a 1:1 and completely suspended the senior secured leverage ratio for over a year. The lenders also stopped redetermining the borrowing base for a year. In the Spring of 2017, lenders very quietly reaffirmed the $4 billion borrowing base with no details on coverage ratios. A quick look at the balance sheet shows a very high debt to earnings ratio, very low cash, and although a large part of the borrowing base is not drawn it is being used, arguably artificially, to maintain the appearance of liquidity. Unfortunately, they are only one example of many in the industry and many others have a much higher draw on borrowing bases that are now not sufficiently collateralized.
By artificially inflating borrowing bases and then changing the rules, lenders are propping up companies and saving them from financial distress and-in many cases-probably bankruptcy. It also keeps banks from realizing enormous losses. However, it creates artificial market dynamics and prevents the corrections that should have been seen with huge over-leveraging followed by price collapse. Lenders and E&P companies had hoped for a price rebound similar to the one in 2009, but it has yet to happen, thus creating more and more pressure from a regulatory standpoint. As the hopes of a bounce back fade and "lower for longer" appears to be the new normal, the resulting questions are how long can the shell game last and who's going to get caught out in the open?
ABOUT THE AUTHOR
Laura Freeman is a reservoir engineer who specializes in services in reservoir engineering and finance. She currently consults for a variety of clients through Laura Freeman Consulting and works on a private equity fund. Freeman has worked with oil and gas operating companies, private equity funds, high net worth individuals, and lending institutions. She provides reserves and asset valuation services as well as work on borrowing bases, M&A, due diligence, investing and deals, field studies, reservoir development planning, reserve evaluations and economics, and fair market value analysis. She graduated from the University of Wyoming with a MS in Petroleum Engineering and holds an MBA from UCLA Anderson School of Management and a Physics BA from Reed College.


