Shale investment and conventional asset sales
© Darren Walker | Dreamstime
Slowing production growth for shale companies
Espen Erlingsen, Rystad Energy
From 2012 until the end of this year, total North American shale oil production is expected to grow from 1.9 to 5.8 million barrels per day (MMbbl/d). As a result, shale has changed the global oil market. When considering this production growth, one would expect the production for the main shale producers to have grown considerably during this period. However, looking at the reported production for the main shale operators, we don't see this trend. In fact, for the last two years, the total production has declined.
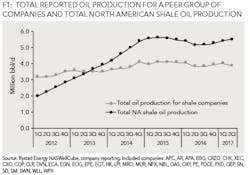
Comparing total shale oil production with the total reported oil production for the main shale producers, Figure 1 shows two different trends. Here, the main shale producers are defined as the 34 largest public shale producers, where the company's main activity is shale (excludes the Majors). Figure 1 shows that since 2012, total production for the main shale companies has grown from 3.1 MMbbl/d, to 3.8 MMbbl/d as of the second quarter of 2017. This is a net growth of 700 thousand barrels per day, or 23%. For the same period, total shale production has grown 3.5 MMbbl/d, or 177%. This shows that even though shale production has grown considerably, shale producers have not been able to fully capitalize on the growth.
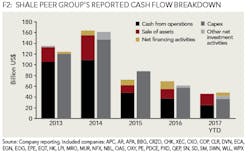
A key reason why shale companies' production growth has been lower than the total shale growth is the cost of developing the shale. Since 2010, the largest shale companies have invested, on average, US$46 billion in shale on a yearly basis, and these investments have been larger than the cash from operations. Figure 2 shows the reported breakdown of the yearly reported cash flows for the peer group of shale companies. It illustrates the cash from operations, cash going to investments, and cash from financing. By comparing the cash from operations (black columns) with Capex (gray columns), a clear pattern is that these companies have invested more than they've earned. In 2014 and 2015, this difference was around US$35 billion. This gap has been financed by various sources, but the key source of additional financing for shale producers has been asset sales.
Many shale producers have sold conventional assets to finance shale activities. Marathon Oil sold North Sea assets, Anadarko sold conventional US onshore assets, and ConocoPhillips sold its share in Kashagan. In total, shale companies have raised US$120 billion in additional financing through asset sales from 2013 until the second quarter of 2017.
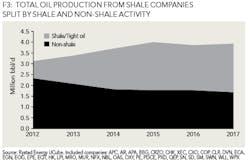
The implication of selling these assets is that the non-shale production for the shale producers has declined considerably from 2012 to 2016. Rystad Energy estimates that for this peer group of companies, the non-shale production has declined by 21% from 2012 to 2017. Companies such as Marathon, Murphy, and Apache have seen non-shale production decline more than 30%. Figure 3 shows the total net oil production for this peer group of companies split by shale and non-shale. Clearly, shale production has grown from 2012, while conventional production has declined. Total shale production for the peer group has grown by about 187%, the same growth level as for the total shale oil production.
The fact that shale companies' production growth has been slower than the growth in total shale production illustrates the challenges faced by shale producers. Investing heavily in shale, companies covered the deficit by selling off conventional assets. In many cases, this shows that the historical activity levels in shale were unsustainable and went on at the expense of conventional production.
Espen Erlingsen is a partner and leader of the E&P team at Rystad Energy. His areas of expertise include company and acreage valuation, breakeven price analysis, and international petroleum fiscal regimes. Before becoming a partner, Erlingsen was the lead NCS analyst at Rystad Energy.
