Newbuild and replacement cost functions
Part one in a two-part series. The second par will run in the September issue of OGFJ.
Mark J. Kaiser and Brian F. Snyder, Center for Energy Studies, Louisiana State University, Baton Rouge, La.
OVERVIEW: Rigs are the primary assets of drilling contractors and their newbuild and replacement costs are frequently required in corporate planning and financial valuation. Cost functions provide insight into the factors that influence costs and are used by investors, government agencies, and other stakeholders to evaluate newbuild programs or the value of an existing rig or fleet. The purpose of this two-part article is to quantify the construction cost of rigs and to develop generalized newbuild and replacement cost functions based on their physical attributes. In Part one we motivate the problem and describe the sample statistics and functional specifications.
Newbuild costs are widely reported in public documents, and because most contracts are turnkey in nature, the values are accurate representations of the costs paid by owners to shipyards, excluding financing and interest expenses. The replacement value of rigs is more ambiguous and is estimated by market intelligence firms, drilling contractors, and insurance companies using specialized algorithms and expert opinion. Replacement costs reflect the costs to replace a rig with a new asset of similar quality. Newbuild and replacement cost data from Jefferies was applied in our analysis.
We focus on the physical factors related to rig capability rather than more difficult to quantify time-dependent factors such as market conditions. The time period of analysis is fixed at October 2009 and the cost functions derived are reflective of newbuilds during this time period. Cost can be adjusted to a future period using an appropriate index, or alternatively, if the sample of newbuilds are updated, a new cost function can be derived and the model re-estimated.
For newbuilds, the sample set included 39 jackups, 35 semis, and 37 drillships and represented the majority of rigs under construction in 2009-2010. A number of jackups were under build by National Oil Companies or on speculation by shipyards, and cost information on these rigs were not available. The replacement cost sample included 282 jackups, 149 semis, and 35 drillships in active, ready-, and cold-stacked status. The world fleet at the time of analysis was 470 jackups, 200 semis, and 50 drillships, and so the sample was reasonably representative of the total inventory. Rigs not included in the sample are those owned by small private operators and National Oil Companies where information on the replacement costs is not available or reported.
Bailey and Sullivan (2009) provide basic information on rig operating water depth, delivery year and design. These data were supplemented with information on drilling depth and environmental operating conditions from RigZone, contractor websites, trade press literature, and design descriptions from naval architecture firms. No adjustments for inflation are made since cross-sectional analysis was performed and all costs are reported in 2009 dollars.
Summary statistics
Average cost
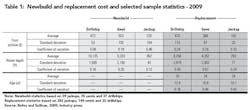
Summary statistics on the average cost and water depth of the rig samples are shown in Table 1. Compared to existing rigs, the average jackup in the newbuild sample costs more ($225 versus $142 million) and was capable of drilling in deeper water depths (362 versus 293 ft). Average newbuild semis and drillships costs were $553 and $672 million, respectively, relative to fleet replacement values of $366 and $470 million. The average cost of all rigs under construction in 2012 are $217 million for jackups, $595 million for semis, and $634 million for drillships, indicating that the 2009 sample is comparable on jackup cost, higher on drillships and slightly lower on semis.
Cost variation
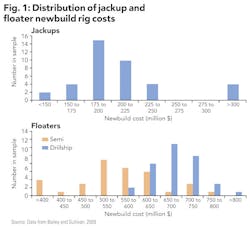
The large dispersion in newbuild jackup costs is primarily attributable to four harsh environment rigs capable of drilling in over 400 ft of water (Figure 1). These rigs each cost over $450 million whereas most other rigs in the sample cost approximately $200 million. There is also wide cost variation among semis due to the presence of harsh environment designs, but less variation in drillship newbuild costs with all drillships costing between $585 and $750 million. The coefficient of variation for newbuild jackups is significantly greater (0.46) than for semis (0.18) or drillships (0.08). The lack of variation among the drillship sample indicates that regression models are unlikely to be able to distinguish the factors that make drillships unique and capture cost variation. Replacement cost is uniform across rig types which is likely due to the manner in which replacement cost is estimated and similar lifecycle and upgrade regimes (Figure 2).
Rig age
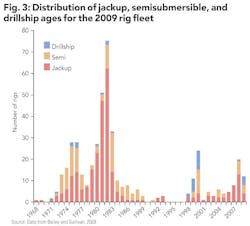
The distribution of rig ages in the world fleet circa 2009 is shown in Figure 3. The drillship fleet is younger and has a smaller vintage range than the semisubmersible or jackup fleet and age is less likely to be a reliable predictor of drillship replacement cost. A primary difference between the replacement and newbuild data is the age range of the vessels. In the newbuild data, all rigs were built in the 2009-2012 period, while in the replacement models rigs were built over several decades.
Age may impact the replacement costs because for all else equal, as technology improves, costs should decrease. For example, a 300 ft water depth jackup with a drilling depth capability of 25,000 ft would have been considered a high specification unit in the early 1980s and may have commanded a premium. By the late 2000s, such a rig would be standard and may be priced at a discount.
Water depth and environmental capability
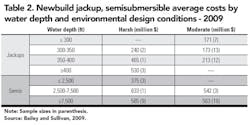
Water depth and operating environment are related determinants of newbuild costs for jackups (Table 2). In harsh environments, jackups with water depth capabilities of 350 to 400 ft cost 90% more than jackups with 300-350 ft water depth capabilities; in moderate environments, the price premium is 23%.
For semis, there is a significant water depth price premium in harsh environments, but a less notable premium in moderate environments. Harsh environment, ultra-deep water semis (>7,500 ft) are 56% more expensive than harsh, midwater units (<2,500 ft), but in moderate environments, the price premium between ultra-deep and deepwater (2,500 to 7,500 ft) is only 4%. Small sample sizes may influence these results, but in general, large cost differences are found in harsh environment rigs because of design variability and country of build differences.
Country of build
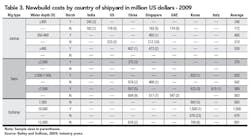
Table 3 shows the distribution of rig costs by country of origin for newbuilds. South Korea (35%), Singapore (24%), and China (20%) captured 80% of the newbuild market in 2009 and continue to reflect current newbuild share. Singapore is the primary jackup builder, China is dominant in semi construction, and Korea dominates drillship construction.
In both the jackup and semi market, there is significant international competition, but in 2009, nearly all drillships were built in Korean yards. Singaporean shipyards have slightly lower costs than their competitors. In every market in which Singaporean yards have market share, the average cost at Singaporean yards is less than in any other nation. No other nation has a notable cost advantage.
Model development
Function specification
Econometric techniques are common in maritime valuation assessments because of their versatility, theoretical foundation and robust estimators. We specify newbuild and replacement cost models using a multi-factor linear functional:
C(U) = α0 + ∑αiXi,
where C(U) represents the cost of rig class U and the number and selection of the descriptor variable Xi is specific to the rig class, user preferences, and data availability.
Variables examined include designed environmental conditions, rig specifications, market conditions, age, upgrades, life extensions, and related factors.
The coefficients of the model formulation are estimated through ordinary least-squares regression and α0 can be interpreted as a fixed-term component. In general, we report the results of several models for each rig class to highlight differences and compare predictors. When multiple models are presented, the "best" model is identified on the basis of R2.
Cost are estimated with and without the fixed-term component and the effects of forcing α0 to be zero were examined because models without a fixed cost component allow for the determination of the relative contribution of each variable. Whenever the intercept term in a regression model is set to zero, the model fit R2 and statistical significance improve due to the manner in which R2 is calculated. There is no meaningful way to interpret R2 values, however, and they are not reported for regressions through the origin. The standard error (SE) of a regression going through the origin is meaningful and we report SE to allow for model comparisons.
Variable description
For newbuilds, the following variables were considered: operating water depth, year of delivery, drilling depth, environmental design conditions (harsh or non-harsh environment), variable deck load, and country of build. For replacement cost, water depth, year of delivery, years since upgrade (effective age), upgrade status, and environmental design conditions were examined.
Variable deck load was not considered in the replacement cost analysis due to data limitations. For jackup replacement and newbuild costs, water depth squared was examined because higher-order terms of deadweight have previously been shown to be a reliable predictor and because rig weight is better correlated with water depth squared.
Water depth, drilling depth and variable load are continuous variables. Delivery year is a discrete variable that enters the newbuild model as X rather than 200X, while for replacement costs, the actual year of delivery is used. Year of delivery precludes using the derived relations in a predictive manner for a future time period. When qualitative variables are used they are referred to as indicator or dummy variables and they take the value 0 or 1; e.g., rigs designed to operate in a harsh environment can be categorized using an indicator variable: HARSH = 1, NOT HARSH = 0.
Expectations
Water depth and drilling depth are expected to be positively correlated with costs for all rig types. Water depth should have a pronounced impact on jackup costs because of the leg length correspondence and the increased cost to build. Newbuild costs are also expected to increase over time because the period of analysis is relatively short (2009 to 2012) and contracts made for later deliveries were finalized in early 2008, before commodity prices fell, credit markets tightened, and shipyard demand was high. Harsh environment rigs are expected to cost more than non-harsh environment rigs and costs are expected to be higher in developed countries such as Korea and the US and lower in China and India. We also expect that newer rigs and more recently upgraded ones will be more expensive to replace than older rigs that have not been upgraded.
References
Bailey, J.E. and C.W. Sullivan. 2009-2012. Offshore Drilling Monthly. Houston, TX: Jefferies and Company. OGFJ
About the authors
Mark Kaiser is a professor and director of research and development at the Center for Energy Studies at LSU. His primary research interests are related to cost analysis and financial modeling in the oil and gas industry. He holds a PhD in industrial engineering and operations research from Purdue University. Brian Snyder is a research associate at the Center for Energy Studies. His research interests include offshore wind energy and the ecological impacts of energy production.
More Oil & Gas Financial Journal Archives Issue Articles
View Oil and Gas Articles on PennEnergy.com
