Some oil sands producers improving their environmental performance
Chris Wilson, Evaluate Energy, Calgary
While overall greenhouse gas (GHG) emissions from oil sands operations are still rising, some producers are improving their environmental performance, according to the latest available government data analyzed by CanOils. Total GHGs from oil sands projects increased 9.3% to 62.8 million tonnes of carbon dioxide equivalent (CO2e) in 2010, this compared with an estimated 13% rise in production CanOils estimates. However, efficiency gains by in situ producers were offset by rising GHG per unit emissions from integrated producers.
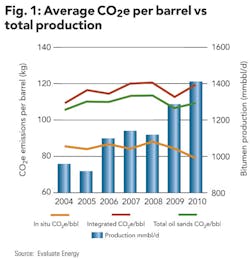
Emissions from integrated projects (those that both extract and upgrade bitumen) increased to an average 119 kg of CO2e per barrel of synthetic crude production in 2010, up from 113 kg per barrel in 2009. In contrast, emissions from in situ projects were down for a second consecutive year, emitting 79 kg for every bitumen barrel of production compared with more than 89 kg in 2007. The combined total average emissions in 2010 were 110 kg CO2e emissions per barrel (See Figure 1).
Total oil sands production rose to more than 1.4 million barrels a day in 2010, an increase of 13% on 2009 production for both integrated and in situ operations. In situ production accounted for 41% of the total, while integrated production made up the remaining 59%.
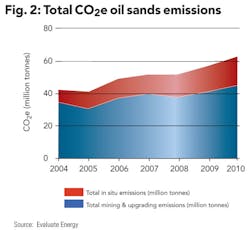
Despite the increased efficiencies from in situ operations in 2010, the impact of larger producing integrated projects and the escalation in production have meant that total emissions in the oil sands have continued to grow (See Figure 2). Integrated projects released 45 million tonnes of oil sands CO2e emissions in 2010, while in situ operations produced 18 million tonnes. These figures were up 9% and 10% respectively on 2009 total emissions.
For operators, cutting emissions at the project level is not just about reducing the environmental impact of their projects, it also means a more efficient project and lower operating costs. For in situ projects, this is due to the large amount of emissions created by burning natural gas to steam raw bitumen out deep within the oil sands deposits. The efficiency measure for this process is called the steam-to-oil ratio (SOR). As a general rule a low SOR equates to lower emissions per barrel and lower operating costs.
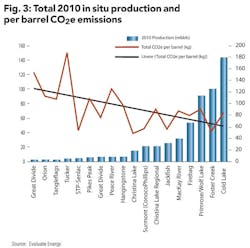
In 2010 the Christina Lake project, operated by Cenovus Energy Inc. had the lowest CO2e per barrel of the in situ projects with an average 48.3 kg CO2e emissions per barrel of bitumen produced. Foster Creek, which is also operated by Cenovus, was the second most efficient project producing only 53.3 kg CO2e per barrel.
The top 10 most efficient projects utilized Steam Assisted Gravity Drainage (SAGD) technology as opposed to Cyclic Steam Stimulation (CSS), utilized extensively in Imperial Oil's Cold Lake operations. Figure 3, taken from the CanOils Oil Sands Service, shows how larger projects have better unit efficiencies.
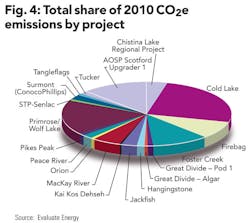
23 oil sands extraction and 7 upgrading or integrated projects reported their 2010 GHG emissions, making up 30 of the largest 163 Albertan and 537 total Canadian facilities required to report data (See Figure 4).
Alberta accounted for 47% of total Canadian emissions and oil sands operations approximately 6.9% of the total. Ontario, which contributed 21%, was second to Alberta. Overall Canada's 2010 emissions remained stable, increasing by only 0.25% to 692 megatons, while the economy grew 3.2% in this time.
Notes
Details of this analysis are available exclusively to CanOils subscribers (www.canoils.com). 2004 to 2010 total and kg/barrel GHG emissions, including carbon dioxide, methane, nitrous oxide and their respective equivalent carbon dioxide (CO2e) on an individual project level are available within the CanOils Oil Sands product.
Greenhouse gases are those gases in an atmosphere that absorb and emit radiation within the thermal infrared range. The main greenhouse gases in the Earth's atmosphere are water vapor, carbon dioxide, methane, nitrous oxide and ozone.
CanOils tracks carbon dioxide, methane, nitrous oxide, and their respective equivalent carbon dioxide (CO2e) release per barrel and by total for every oil sands project. In the CanOils database, methane, nitrous oxide and ozone emissions are converted to CO2 equivalent based on the US Environmental Protection Agency Global Warming Potential (GWP) factors under which CO2 has a GWP of 1, methane a GWP of 21 and Nitrous oxide a GWP of 310.
Syncrude is raw produced bitumen that has been upgraded to synthetic crude oil.
Air pollutant emissions data were compiled in collaboration with provincial, territorial, and regional environmental agencies by Environment Canada, National Pollutant Release Inventory (NPRI). Facilities report their own pollutant release and transfer data to Environment Canada. Only facilities emitting the equivalent of 50,000 tonnes are reported and therefore pilot projects are not included. Total oil sands emissions data refers to total project coverage in the CanOils database.
There are two main ways of extracting oil sands – mining, in which the bitumen is located with 80 to 100 meters of the surface, and in situ, whereby the bitumen is located in deeper reservoirs and is produced using steam injection or other enhanced recovery methods.
About the author
Chris Wilson is a senior analyst at Evaluate Energy [www.evaluateenergy.com].
More Oil & Gas Financial Journal Archives Issue Articles
View Oil and Gas Articles on PennEnergy.com
