Revisiting the pitfalls and misuse of WACC

M. A. Mian
Saudi Aramco
Dhahran, Saudi Arabia
Many companies use the discounted cash flow (DCF) approach as the primary technique of investment/project evaluation and capital budgeting process. This approach requires forecasting detailed cash flow of the project under evaluation and then discounting the resulting cash flow to the present value (net present value - NPV) using an appropriate discount rate.
The discount rate commonly used represents the weighted average cost of capital (WACC) of the firm. Although the WACC has been used as a standard for the last 30 years, it is now obsolete.1
The WACC approach is based on many unrealistic assumptions that, unfortunately, often fail to hold. This results in calculation of overly optimistic NPV. The company CEOs, management, analysts, and other investors using WACC for investment decisions need to be fully aware of its pitfalls and misuse. There has to be a compelling virtue that justifies the use of WACC.
This paper highlights the (a) pitfalls and misuse of the WACC, (b) interdependence between type of cash flow and WACC, (c) assumptions behind the WACC and whether these assumptions are realistic, and (d) recommends to either using the cost of equity or the adjusted present value (APV) approach to arrive at the net present value (NPV). If the debt structure is such that it can be easily captured by the cash flow, then using the cost of equity and the equity cash flow would suffice.2
Defining WACC
The weighted-average cost of capital (WACC), as the name implies, is the weighted average of the firm’s overall capital structure, i.e. its cost of equity (re) and its cost of debt (rd). For the purpose of this paper it is assumed that the firm’s cost of equity and cost of debt have already been calculated using the acceptable financial techniques, such as the capital asset pricing model (CAPM). Some analysts misinterpret the WACC as a synonym of CAPM. This is not correct. The WACC is just an algebraic manipulation to combine the re and rd into their respective proportion reflecting the capital structure of the investor. The WACC is a bit of a black box-too much is rolled into a (deceptively simple) tax adjustment to the “cost of debt” as shown in the following equations.
After-tax WACC
WACCAT = We × re + Wd × rd(1 - Tc)(1)
Before-tax WACC
WACCBT = We × re + Wd × rd(2)
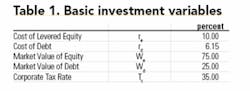
The two equations above define the WACC in terms of the following variables. The numerical values of these variables, assumed in this article, are shown in Table 1.
1. Cost of levered equity, re
2. Cost of debt, rd
3. Market value of equity, We, fraction of value of the firm
4. Market value of debt, Wd, fraction of value of the firm
5. The corporate tax rate, Tc
The WACC equations are basically composed of three parts. The first part (We x re) represents the equity portion of the cash flow, the second part (Wd x rd) represents the debt portion of the cash flow, and the third part (1 - Tc) in the second term of Equation (1) adjusts the interest payment for the tax benefit due to the tax-deductible interest payments. The WACCAT and WACCBT for the data in Table 1 are calculated as shown below.
WACCAT = 0.75 × 10% + 0.25 × 6.15%(1 - 0.35) = 8.5%
WACCBT = 0.75 × 10% + 0.25 × 6.15% = 9.04%
The WACC represents the expected return on a portfolio of all the company’s securities, i.e. equity and debt. This rate is applied to project cash flows - cash flows excluding the cash outflows due to financing (i.e. interest payment, principal payment, or the tax benefit created due to the tax deductible interest payments). The side effects of the project financing are instead bundled in the WACC.
In reality, due to its very restrictive and unrealistic assumptions, the WACC has never been that good at handling these financial side effects. In its most common formulations, it addresses tax effects only-and not very convincingly, except for simple capital structures.1
Defining cash flows
The reason for defining various cash flow streams is that the WACC is applicable to only a certain type of cash flow. The difference between the various cash flows is solely in their treatment of the value of leverage. This is a very crucial point, which is always overlooked.
This point has significant implications with respect to the definitions of the cost of capital, cost of equity, and cost of debt. Ignoring this point leads to considerable confusion and potential errors in applying the discounted cash flow concept. In fact, this is where most analysts violate the assumptions on which the discounted cash flow concept is based and thus start misusing it.
Furthermore, NPV is not the only profitability indicator that will always suffice in project evaluation. The analysts will, most of the time, require other profitability indicators such as the discounted payback period, internal rate of return (IRR), profitability index (PI), growth rate of return (GRR), etc. Some of these, such as the discounted payback period, will supplement the NPV while others will supplant the NPV.
These profitability indicators will be different for each cash flow stream. Therefore, in order to arrive at consistent and meaningful project economics, only one of the cash flow streams is strongly recommended.
The most straightforward and intuitive way to see the differences is to numerically specify a particular cash flow, with its respective cost of capital, and then compare the resulting profitability yardsticks from the various cash flow streams. Some of the most commonly encountered cash flows in text books and journals are:3
FCF (Free Cash Flow) - as shown in Table 2, FCF assumes a hypothetical all equity capital structure, i.e. total net cash flow-no disbursement of interest and principal payments to debt holders. The interest and principal payments and tax benefits due to deductible interest payments are incorporated in the discount rate (after-tax weighted average cost of capital, WACCAT) rather than the cash flow.
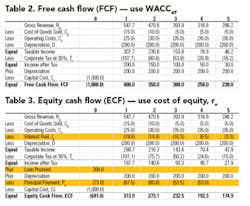
ECF (Equity Cash Flow) - includes debt payments (principal and interest) to debt holders. The resulting cash flow, as shown in Table 3, is net to the Equity shareholders. This is the classic cash flow and portrays a true image of the cash balance at the company’s treasury. Since the debt cash flows are included in the cash flow, the cost of equity (re) rather than the WACCAT is used for discounting.
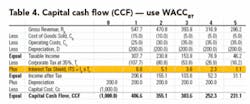
CCF (Capital Cash Flow) - cash flow is available to both equity and debt holders. As shown in Table 4, it includes only the tax benefit of tax deductible interest. Since the tax benefit is included in the cash flow, the before-tax weighted average cost of capital (WACCBT) is used for discounting.
CFD (Cash Flow to Debt Holders) - interest and principal payments, to the debt holders, on the outstanding debt.
The differences in the three cash flows, using Table 2 as the base case, are highlighted in Tables 3 and 4. All cash flows will incorporate adjustments to transform the accounting recognition of receipts and disbursements into cash flow definitions. The adjustments include operating expenditure, capital expenditure, depreciation, depletion if applicable, amortization, changes in working capital, loss carry forward, and any other cash or non-cash expenses.
The only difference is in the treatment of CFD. The non-cash expenses such as depreciation, amortization, depletion, and loss carry forward etc. are subtracted from the taxable income and then added back to the Income after Tax. The capital cost and changes in working capital are subtracted from the Income after Tax only.
Calculating profitability indicators
Remember that the definition of the weighted average cost of capital depends on the definition of the cash flow stream. Therefore, the correct execution of the concept of WACC becomes critical.
For example, using the definition of cash flow from one approach and the cost of capital from an alternative approach will not give correct value of the project under evaluation. Many experienced analysts have committed these mistakes so the matter is not trivial.
The WACCAT of 8.5 percent is used to calculate the NPV of the cash flows in Tables 2, 3, and 4 as $234.22, $266.94, and $249.86, respectively. As one should expect, based on the definitions of each cash flow and the WACCAT, all three NPVs are different.
This clearly shows that the WACC is not a fit-for-all cash flows.4-6 The NPV = $234.22 for the cash flow in Table 2 is correct but the other two NPVs are incorrect. The reason why NPV of the cash flow in Table 3 is not correct is that:
• The cash flow already accounts for the CFD (loan proceeds, interest payment, principal payment, and tax benefit due to the interest payment) and
• At the same time the WACCAT is also adjusted lower to pick up the financial side effects.
Similarly, the NPV = $249.86 of the cash flow in Table 4 is not correct because the tax benefit due to the interest payment is incorporated in the cash flow and at the same time in the WACCAT.
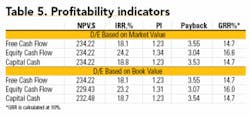
As shown in Table 5, the NPV for all three cash flows calculates to $234.22 provided the right combination of cash flows and discount rate is used and all the assumptions are met. The right combination is, of course, discounting the FCF by WACCAT, the ECF by re, and the CCF by WACCBT.
However, this has solved only one problem, i.e. the NPV calculation. What about the other profitability indicators? Does IRR of the FCF in Table 2 recognize that the equity is leveraged? The answer is no, not at all. Similarly, in the FCF and CCF, all other profitability indicators use equity of $1,000 rather than $691.4 or $750.0 if the book value is used. The FCF is equal to the after-tax cash flow of an otherwise identical project with no debt.
Assumptions of the WACC
Beside the interrelationship between the cash flows and WACC, the approach is based on the following assumptions:
1. The debt-to-value (D/V) ratio is constant over project evaluation life. The D/V ratio is based on the market value of the investment and not the book value. The market value of equity and the market value of debt refer to the equity and debt proportion of the market value (V) of the firm, respectively, so that We + Wd = V.
The market value is the discounted value (discounted at the WACCAT) of the FCF. Therefore, V is not the book value, the amount invested, or the project cost as it is most commonly interpreted. This is a very crucial assumption of the WACC concept. The market value of debt and the corresponding interest and principal payments (CFD) for the cash flow in Table 3 are calculated as shown in Table 6.
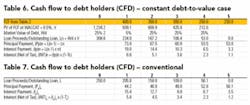
However, the constant D/V ratio does not fit well with observed practice and/or may be difficult to maintain. Firms more typically manage issue amounts and repayment schedules, and would find it very difficult to maintain a constant debt ratio in a world of changing equity values.
The profitability indicators in Table 5 (based on book debt/equity ratio) show that if the constant D/V ratio assumption is violated, all three discount factors will give different NPVs even if the right combination of cash flow and discount factor is used. The book CFD is shown in Table 7.
2. The corporate tax rate is constant throughout the life of the investment, i.e. no tax holidays or sliding scale taxes.
3. The term rd(1 - Tc) in Equation (1) implies that the tax payments coincide in time with the interest payments.
4. The term rd(1 - Tc) in Equation (1) also implies that interest will be paid every year throughout the life of the project.
5. Assumes that the tax shields are always realized in the year in which they occur. This means that earnings before interest and taxes are greater than or equal to the expected interest charges.
6. There are no losses carried forward.
7. The capital cash flow must equal the sum of equity cash flow and cash flow to debt holders, i.e. CCF = ECF + CFD.
8. The interest tax savings must equal the capital cash flow minus the free cash flow, i.e., ITS = CCF - FCF
Textbook versus real investments
The above discussion dealt with textbook cases of the WACC concept. However, in practice the execution of this concept becomes even more complicated and restricted. Over the years, since inception of this concept, the textbooks and literature have conveniently avoided its use and limitations in practice. Most conventional investment/ project evaluations may involve:
• Two to four years of construction period in which capital is spent and there is no revenue.
• Interest accumulates on borrowed money during this construction period.
• Tax holidays and/or variable tax rates.
• Debt repayment schedule less than the total evaluation period of the project.
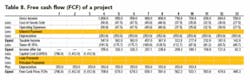
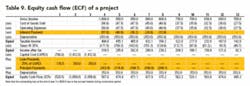
Tables 8 and 9 show classic project cash flows. Table 8 shows FCF of a 10-year project with three years of construction period. Table 9 shows ECF of the data in Table 8 with the addition of a five-year debt repayment schedule. A similar table, not shown here, was also developed for CCF of the same project. Conventional, not based on market value of project, debt repayment schedule is used to payback the debt in five years. Interest is applied to the debt during the construction period.
The NPVs of the cash flows in Tables 8 and 9 and the CCF of the same project are shown in Table 10. The difference in the NPVs is worth noting. The NPV based on the WACCAT is 156 percent more than the NPV of the ECF. This clearly shows that violating the assumptions on which the methodology is based (i.e. market value of debt and the constant debt-to-value) could be catastrophic.
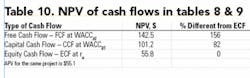
The magnitude of the difference depends on the cash flow pattern. In some cases the difference may not be as severe as shown in this example. Such a difference can easily lead to selecting an investment that will show a positive NPV, but the investment will actually lose on equity.
The above analyses prove that the only compelling virtue for advocating the use of WACC is that it requires simplified cash flow. This property, of course, could have been important in the past to users of calculators, interest tables, and/or slide rules. However, due to the tremendous power of spreadsheets like Excel, that advantage is irrelevant today. Moreover, one has to make sure that the simplification is worth compromising on the ultimate decision making.
Based on the above analyses, it is recommended to use the ECF and the cost of equity (re) combination to calculate the NPVs. The ECF is also the cash flow that, at the end of the day, will be used for budgeting and planning purposes. The ECF methodology is a good way to obtain a lower bound for the value of the equity. The NPV based on ECF may, at times, be slightly conservative. This is because the levered cost of equity (derived from CAPM) is used throughout the project life.
Since after the five-year debt repayment schedule the un-levered cost of equity will be somewhat less than the levered cost of equity, the NPV may be slightly conservative. By using the Adjusted Present Value (APV) method, the NPV for the same investment was calculated to be $55.1. OGFJ
References
1. Timothy A. Luehrman, “Using APV: A Better Tool for Valuing Operations,” Harvard Business Review, May-June 1997.
2. Mian, M. A., Project Economics and Decision Analysis - Vol. I: Deterministic Models, PennWell Publishing., 2002.
3. Richard S. Ruback, “A Note on Capital Cash Flow Valuation,” Harvard Business School, January 19, 1995.
4. Richard S. Ruback, “An Introduction to Cash Flow Valuation Methods,” Harvard Business School, October 16, 1995.
5. Donald R. Chambers, Robert S. Harris, and John J. Pringle, “Treatment of Financing Mix in Analyzing Investment Opportunities,” Financial Management, Summer, 1982.
6. Keneth J. Boudreaux and Hugh W. Long, “The Weighted Average Cost of Capital as a Cutoff Rate; A Further Analysis,” Financial Management, Summer, 1979.
About the Author

M. A. Mian [[email protected]] is an engineering specialist in the Upstream Ventures Department with Saudi Aramco in Dhahran, Saudi Arabia. He has more than 25 years’ experience in evaluating multi-billion dollar oil and gas projects. Mian is the author of four books “Petroleum Engineering Handbook for the Practicing Engineer, Vol I and II” and “Project Economics and Decision Analysis, Vol. I and II,” published by PennWell Books, Tulsa, Okla.