High prices boost income for 50 independent firms
This will come as no great shock to those in the industry, but fourth-quarter results for 2004 show that independent oil and gas producers, oil field service companies, and refiner/marketers had significantly increased income over the year-ago quarter.
In its quarterly review of trends in the financial performance of independent energy companies for October through December 2004, the US Department of Energy’s Energy Information Administration (EIA) studied the companies’ reports to stockholders and issued a detailed analysis. The independent companies the agency tracks are typically smaller than the majors and do not have integrated production and refining operations.
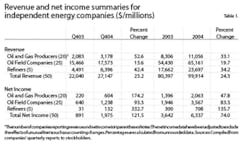
Earnings for the 50 independents included in the report grew 122 percent in the fourth quarter (Q404) over earnings in the fourth quarter of 2003 (Q403). Table 1 shows revenue and net income summaries for these companies.
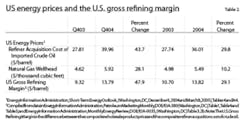
All three types of energy companies included in the report - independent oil and gas producers, oil field service companies, and refiner/marketers - showed income gains as crude oil prices, natural gas prices, and the gross refining margin all increased (Table 2). All three groups also showed growth in their total yearly earnings, as net income grew 74 percent for the 50 companies in 2004 over the previous calendar year.
Crude oil prices
The EIA reported that crude oil prices increased by nearly one-half, while domestic natural gas prices grew by more than one-fourth, relative to a year ago. The higher prices were a major contributing factor to the improved bottom lines of these companies.
The US refiner average acquisition cost of imported crude oil increased 44 percent relative to a year ago, from $27.81/bbl in Q403 to $39.96/bbl in Q404 (Table 2). Several factors contributed to increased oil prices, including the lingering effects of Hurricane Ivan, the US economy’s four-percent growth during the period, and a three-percent increase in world oil demand relative to a year earlier, according to the EIA’s March “Short Term Energy Outlook.”
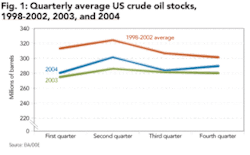
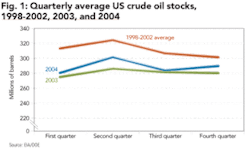
The effects of these factors were somewhat offset by a three-percent increase in world crude oil supply, slightly higher stock levels in the countries of the Organization for Economic Cooperation and Development relative to Q403, and higher US stocks (Fig. 1), which increased three percent relative to Q403.
This was the 10th consecutive quarter in which crude oil prices increased relative to their year-earlier levels, after six consecutive quarters of falling or unchanged crude oil prices (relative to a year earlier). The average price of crude oil was 30 percent higher during 2004 than during 2003 as the effects of four-percent economic growth and a four-percent increase in world demand were somewhat offset by a four-percent increase in world supply.
Natural gas prices
The average US natural gas wellhead price rose 28 percent between Q403 and Q404, from $4.62/MMcf to $5.92/MMcf (Table 2). A two-percent increase in US demand for natural gas, a four-percent decline in domestic production (largely due to the after-effects of Hurricane Ivan, which reduced natural gas production in the Gulf of Mexico), and an overall three-percent decline in domestic natural gas supply all put upward pressure on domestic natural gas prices.
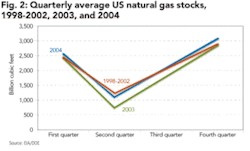
Undercutting higher natural gas prices were both a higher opening level of working gas in storage (Fig. 2), which was eight percent higher in Q404 than in Q403, and a 20-percent increase in net imports of natural gas. The average domestic natural gas price in 2004 was 10 percent higher than in 2003, as new domestic supply declined two percent, total domestic supply decreased one percent, and domestic demand increased one percent.
Producer earnings
Net income of the 50 independent oil and gas producers included in the EIA report rose 174 percent between Q403 and Q404, from $220 million in Q403 to $604 million in Q404, as revenues grew 53 percent, from $2.1 billion to $3.2 billion (Table 1).
Independent oil and gas producer earnings were boosted by a 44-percent increase in the price of crude oil and a 28-percent increase in the price of natural gas over year-ago prices (Table 2). All but one of the 20 producers included in the report had higher earnings over the year-ago quarter. Yearly total earnings showed a similar pattern, growing 48 percent from $1.4 billion in 2003 to $2.1 billion in 2004.
Service and supply companies
Higher drilling rig counts contributed to the improved revenue and earnings of oil field service and supply companies. Net income of US service and supply firms included in this report jumped 93 percent, from $640 million in Q403 to $1.2 billion in Q404, as revenues rose 14 percent, from $15.5 billion to $17.6 billion (Table 1).
Earnings of domestic service and supply companies were strengthened by an increase in the worldwide rig count of 10 percent from 2,308 in Q403 to 2,531 in Q404, according to data from Baker Hughes Inc. Higher rig counts and the resulting higher demand for rig services directly increased the demand for the equipment and services supplied by these firms.
This increase in demand raised day rates on equipment and margins on overall operations, thereby increasing companies’ profits. Yearly total earnings also showed healthy growth, increasing 83 percent from $1.9 billion in 2003 to $3.6 billion in 2004.
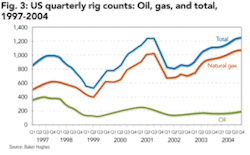
The rig count growth rate for the US was slightly higher at 13 percent, rising from 1,109 in Q403 to 1,249 in Q404 (Fig. 3). Decomposing the total US rig count into its natural gas and oil components shows that both types of rigs contributed to the growth, with the oil rig count growing 14 percent, and the natural gas rig count growing 12 percent.
The natural gas rig count has now increased for eight consecutive quarters relative to its year-earlier level. For the year as a whole, the average natural gas rig count grew 18 percent from 872 in 2003 to 1,025 in 2004, while the oil rig count grew five percent from 157 in 2003 to 165 in 2004.
Breaking down overall (oil plus natural gas) rig counts on a regional basis shows that rig counts grew 13 percent in the US from Q403 to Q404, three percent in Canada, and nine percent in the rest of the world. Yearly total rig counts grew 15 percent in the US from 2003 to 2004, declined one percent in Canada, and grew eight percent in the rest of the world.
Refiner earnings
Earnings of the independent refiners included in this report increased 333 percent from $31 million in Q403 to $132 million in Q404 (Table 1). Refiners’ increased costs of acquiring crude oil was outweighed by even greater increases in the prices of the refined products those companies sell.
This resulted in an increase in average refining margins of 48 percent from Q403 to Q404 (Table 2). (The average refining margin is the difference between the composite wholesale refined petroleum product price and the composite refiner acquisition cost of crude oil.)
Yearly total earnings also showed strong growth, increasing from $300 million in 2003 to $708 million in 2004.
The next EIA financial update for independent energy companies, for January through March 2005, will be released in June. OGFJ
