CAUTIOUS investment approach driving oil company strategies
Having endured boom-and-bust cycles previously, many E&Ps believe they were overly optimistic in previous mini-booms.
Operating results for 2004 are in and, not surprisingly, they reveal record earnings and unprecedented operating cash-flow levels. First quarter 2005 results confirm the trend in fiscal 2004, as record high commodity prices continue. Yet, what also follows these results is another round of increased stock buy-back announcements by many of the companies.
This raises some important questions:
• When will oil companies begin to increase investment levels commensurate with their cash-flow increases?
• Are there fewer opportunities, even at these highly favorable commodity prices, to earn acceptable rates of return?
• Is the lack of investment a sign they believe commodity prices are destined to fall?
• Will energy companies rely on M&A markets to replace reserves?
Answers to these and other questions will likely begin to unfold in 2005. What we already know is that worldwide demand for energy continues to rise. Crude oil demand is expected to reach 84 million b/d in 2005 and is forecasted to reach 120 million b/d by 2030. The capital investment required to meet this demand is estimated at a staggering $4 trillion, or $160 billion annually, according to the International Energy Agency.
On the natural gas side, North American consumption is expected to rise 36 percent between now and 2020, according to the US Department of Energy, while gas production in North America, given current decline rates, is unlikely to grow over this period. Given this set of facts, why do the international oil companies (IOCs) seem to be resisting a ramp up in investment activity?
To understand the companies’ current strategies, let us review their past reactions to commodity price spikes. We will then examine cash-flow investment over the past two fiscal years and discuss why the companies reacted differently during this cycle than in previous cycles.
There is no question the current cautious investment behavior is a reflection of what has happened in the past. During previous mini-booms characterized by significant commodity price spikes, oil companies ramped up spending and, in many cases, drilled marginal or very high risk projects driven on economics that were too optimistic. In addition, M&A activity would increase significantly and asset prices would rise accordingly.
Inevitably, prices would fall and large asset write-downs would be the consequence, resulting in significant stock punishment by Wall Street. As a result, shareholder returns in the oil industry (by any measure) have been below par for the past 20 years and it’s the investment reaction during the boom times that has contributed to the shortfall. With that as a backdrop, it’s not surprising that this time a more cautious investment approach is driving company strategies.
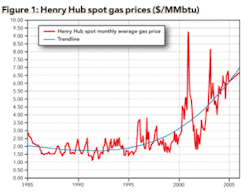
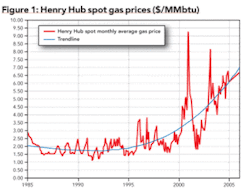
Ultimately, increased investment depends in part on whether companies believe these current commodity price levels are more permanent than temporary. First, with respect to natural gas, industry executives appear to be more comfortable with a new North American natural gas pricing environment. The resulting LNG projects are a testament to that (Fig. 1).
LNG projects are highly capital intensive, but those major dollars will be spent in three to five years. Current projections have global LNG spending totaling $65 to $70 billion from 2005 through 2009. Compare that with the approximately $20 billion spent the past five years.
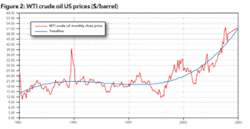
With respect to crude oil, it appears there is still concern that all price spikes eventually return to $20 (Fig. 2). It is worth noting, however, that the last five years represents the longest ever sustained run-up over $20. That aside, the IOCs are likely to continue to use $20 to $25 prices to run their long-term project economics.
The longer crude stays high, the more the industry is likely to begin to feel more comfortable with a higher crude oil band and perhaps a permanent structural change in the oil markets. The Organization of Petroleum Exporting Countries (OPEC) is certainly more comfortable with a higher band. The previous $22 to $28 price band is all but history.
Given these dynamics, will the IOCs begin to move the bar on project economics to $30, and would this drastically increase their spending? It sure looks that way.
Hydrocarbons are becoming more and more difficult to find (especially major fields) and produce at acceptable returns. This is due to a number of factors. One is geology and the maturity of the IOC’s base territory, which combined with rising oil service costs is starting to push reserve replacement rates down and F&D costs up.
In what might be an ominous trend, all five IOCs in our study reported less than 100 percent Securities & Exchange Commission-defined reserve replacement for 2004. Many new studies have been released showing North American F&D costs up over $10/boe. In addition to reserves becoming harder and more costly to find, there are political barriers to quality projects. There is a growing tendency among host governments to threaten punitive fiscal measures when the oil price is high. (Witness Russia, Venezuela, Trinidad, and Bolivia this year).
Finally, another obstacle that could hinder access to quality projects is the appetite of the National Oil Companies (NOCs) - apparently driven more by security-of-supply concerns than a desire to beat their hurdle rates - which are bidding up asset prices globally.
In summary, geologic maturity, rising service costs, hardball tactics by host governments, and the emergence of the NOCs on the global scene may result in $30 economics as the new minimum that high-risk international ventures require in order to earn acceptable rates of return. Recent studies indicate that North American F&D costs are up significantly to more than $10/boe, depending on the study. Ultimately, this is another reason we are unlikely to see $20 oil anytime in the near future.
Operating cash flow
At this point we will review the 2003 vs. 2004 operating cash flows and analyze the companies’ investments. Our sample includes the top 20 public oil and gas companies (the five largest IOCs and the 15 largest North American independents).
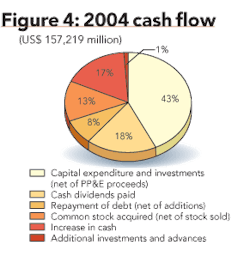
Total operating cash flow of our sample increased 30 percent in 2004 over 2003 to $157 billion from $121 billion. This increase was largely commodity price-driven and not production volume-driven. In fact, production volumes have been decreasing.
The most significant reduction in volumes came from the IOCs which, for example, produced 1.2 bcfd less North American gas in 4Q2004 compared to 4Q2003 - a decrease of approximately 10 percent, according to figures from John S. Herold Inc.
West Texas Intermediate (WTI) averaged $41.50/bbl in 2004 compared to $30.85/bbl in 2003. Natural gas at Henry Hub (HH) averaged $5.98/mcf in 2004 compared to $5.34/mcf in 2003.
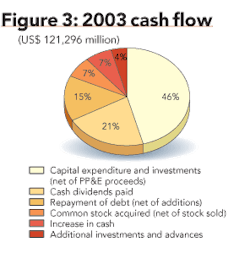
Although net capital expenditures increased to $67 billion in 2004 compared to $57 billion in 2003, as a percentage of operating cash flow, this investment fell to 43 percent from 46 percent.
Cash dividends paid increased to $28.7 billion from $25.7 billion, but as a percentage of cash flow, decreased from 21 percent to 18 percent. However, companies have chosen stock buy-backs as the preferred method of returning cash to shareholders. The amount of stock buy-backs increased substantially from $8.0 billion in 2003 to $19.9 billion in 2004, up 148 percent, and represented 13 percent of 2004 operating cash flow.
Share buy-backs are traditionally utilized when management believes the market is undervaluing the stock. To date, it appears Wall Street has responded positively to the stock buy-back programs, as it purportedly demonstrates prudence and that management has shareholder value - not just growth - at the very top of its priorities.
Debt repayment has decreased dramatically from $17.8 billion in 2003 to $13.0 billion in 2004, as the market has become more comfortable with the company leverage levels in the current interest rate environment.
The final piece of the cash-flow analysis above relates to increasing cash levels on the balance sheet. A sizeable $26.6 billion of the 2004 cash flow went unspent and accumulated on the balance sheet, as the cash accounts of our sample finished the year at over $50 billion. Clearly this cash buildup highlights the opportunity constraints the industry faces - even though falling reserve replacement increases the pressure to find new projects, this growing cash pile shows how hard it is to do.
IOCs versus independents
The IOCs and independent petroleum companies differ in their cash-spending strategies based on their shareholder base, and hence, market expectations. The IOCs are more total-returns driven (which includes dividends), while the independents are more growth oriented with clearly a strong earnings focus (capital appreciation).
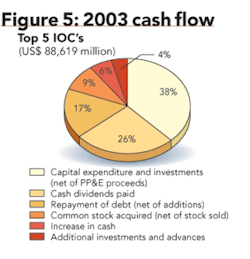
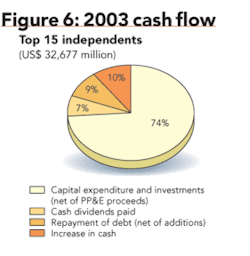
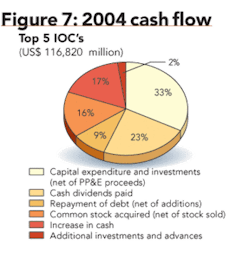
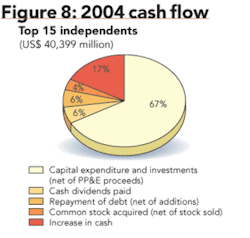
An analysis of the IOCs vs. the independents is illustrated below in Figures 5, 6, 7, and 8.
The biggest difference between the groups is cash dividend payments. The IOCs paid $26.4 billion in dividends in 2004, which represented 23 percent of cash flow, compared to the independents, which only paid $2.2 billion or six percent cash flow.
Independents reinvested 67 percent of their 2004 cash flow, which represented a seven percent reduction from 2003. The IOCs reinvested only 33 percent of their 2004 operating cash flow, a reduction of five percent from 2003 levels.
The other noticeable difference between groups is the area of stock buy-backs. In 2003 the independents had minimal levels. In 2004 buy-backs totaled $1.7 billion or four percent of cash flow. The IOCs continued their aggressive stock buy-back programs totaling $20.1 billion in 2004, up from $8.8 billion in 2003, but consistently around 17 percent of cash flow.
Finally, both groups saw their cash levels rise significantly, as 17 percent of 2004 cash flows were not invested but were retained on the balance sheet.
Rising bank accounts
Perhaps the most surprising part of the analysis is the rising levels of cash on the company balance sheets. Although it’s difficult to estimate rates of return on these amounts, it’s likely less than five percent.
The first point to recognize is that the pace of these rising cash flows was likely unplanned and unexpected by company management. The decision to invest, repay debt, buy back stock, or increase dividends cannot be made simultaneously as cash-flow levels increase. Continually rising commodity prices make it difficult for management to react to invest immediately.
Secondly, many companies likely have plans over the next two to three years to increase investment. Certainly we know this to be the case with LNG projects. In addition, the IOCs face significant downstream expenditures over the next few years as new sulfur restrictions become reality.
Finally, it is likely that many companies are eyeing large international upstream investments. We have already seen some of that activity.
Hedging strategies
Another interesting area to review during this current cycle has been the companies’ approach to hedging. Although the exact figure is difficult to obtain, we estimate that realized commodity price hedging losses in 2004 and 2003 were $2 to $3 billion. What is particularly interesting is that the 2004 losses occurred at a time when companies were not spending, nor planning to spend all their cash flow. Neither were they engaged in significant debt repayment plans.
This would seem to suggest that oil companies utilize hedging programs as an offensive - not a defensive strategy. If hedging is not utilized to protect a capital program or a debt repayment plan, then it likely reflects the company’s belief that at historically high levels of commodity prices, some insurance needs to be purchased.
It should also be noted that the independents engage in significantly more hedging activity than the IOCs, who consider their integrated operations to be naturally hedged. Among the independents, the strategies vary significantly from very little hedging to 60 to 70 percent of next year’s production.
Finally, it is likely that significant hedging is done to lock in certain returns on acquisitions made at high prices. In some ways this is also a defensive strategy as it mitigates the possibility of a significant earnings disappointment should commodity prices turn downward.
M&A outlook
Do these strong balance sheets and large cash levels mean an increase in M&A is likely? Not necessarily.
Sellers continue to demand very high prices, and the sector has shown great discipline in the face of the highest extended commodity price cycle on record. However, I believe the longer that commodity prices remain high, the more likely it is that the executives, especially at the independents, will become comfortable with M&A prices at higher levels.
As a group, our sample of independents ended the year with more than $12 billion on its collective balance sheet. While drilling will increase slightly (most 2005 Capex budgets are up about seven to eight percent), this small increase will likely be fully financed by operating cash flow, which is forecast to be at or above 2004 levels.
Additional spending activity would likely entail a significant increase in exploration activity. But, so far, the companies have shown that they simply feel the risk-reward equation is not sufficiently favorable - even at these high commodity prices.
In addition, substituting new international production is not without its challenges. Large new fields are usually in deep water areas and can take five to seven years to develop. The bottom line, finding and developing oil and gas is becoming difficult and expensive. Therefore, given the need to grow and to show growth sooner rather than later, acquisitions remain the best alternative, and this activity will be financed with the war chest noted above.
Although difficult to predict, it is possible there will be a triggering event that may start a wave of M&A activity. It could be a major deal, (this tends to be a follow-the-leader industry) or a softening of oil prices that may increase sellers’ desires to get something done. One could expect that any large deal would be combined with aggressive hedging to lock in return levels in the early years.
As for the IOCs, one could expect them to focus on LNG projects, oil sands development, and large international joint venture opportunities. Where expected cash flow continues to exceed these investments, stock buy-backs will likely continue.
Conclusion
Early in the article, I referred to $160 billion/year in spending to meet worldwide energy demand. Although the national oil companies will increase spending as their cash flows increase, each of the countries (particularly OPEC nations) have its own unique issues that will result in these increasing cash flows being channeled elsewhere and not reinvested in the oil fields. Therefore, it is this group of companies, led by the IOCs, that must continue to lead the way and deliver the needed investment.
The cautious investment approach of the last two years has been a positive development. The result has been a much-needed increase in credibility from the investment community for an industry that has been criticized in the past for uneconomic investments during short-term, high-commodity price cycles.
It is likely that over the next 18 months, however, that cash investment allocation percentages will return to their higher 2003 levels. In addition, the $50 billion on the balance sheet will begin to be reinvested in exploration and development or utilized in increased M&A activity.
Fiscal 2005 could ultimately be the beginning of a period of the highest increase in capital investment ever by the major players in the oil and gas industry. OGFJ
The author
Rick Roberge is a partner in the Houston office of PriceswaterhouseCoopers’ Energy Transaction Services group. He has more than 13 years’ experience advising clients on mergers and acquisitions, including detailed financial modeling, structuring, capital market analysis, and purchase price determination and negotiation strategy.
