Comparison of methods used to calculate netback value
The purpose of this article is to numerically show three different methods that can be used to calculate netback value (NBV) for pricing natural gas. Netback pricing is a contractual arrangement in which the price of gas at the wellhead is based upon the processed gas or products.
Using netback, the producer-processor starts with the sales price of the processed gas or products, and then subtracts certain costs (such as capital, operating, processing, taxes and transportation) to determine value of the gas when production is complete. In essence, it is backward calculation of price starting from the consumer to the wellhead.
Technically, the NBV is defined as the present value of the net benefits of a project (excluding the cost of gas/feedstock used), divided by the present value of the volume of gas consumed. It represents the gas price that would cause the project to breakeven at the investor’s expected rate of return (ROR).1
When gas is used as fuel for a power plant that can also use liquid fuel (combine cycle) then the economic NBV of natural gas is the value the consumer saves on the alternative fuel - what the consumer would have purchased, had gas not been available. Therefore, NBV is the maximum price that the consumer is willing to pay for the fuel.1
The netback approach used for calculating the value of natural gas is only a starting point. The magnitude of the NBV is highly dependent on the assumptions used in calculating it. Its value is also dependent on the discount rate used and the duration over which it is desired.
Three commonly used methods of calculating the NBV and the resulting gas prices are shown here. The objective is to show which of the three methods closely represents the reality, limitations of each method in practice, and how to interpret the derived NBV in terms of gas price. The method of NBV calculation is very simple and straightforward but failure to base it on adequate methodologies could be detrimental.
The data used in demonstrating the different methods of NBV calculation are presented in Table 1. The calculations require pricing gas feed for a hypothetical 300 metric tons per day (MT/D) methanol plant. It is assumed that about 35 MMbtu of methane-rich sales gas (feedstock) produces one metric ton of methanol. The plant’s capital cost (CAPEX) is estimated to be $80 million and its annual operating cost (OPEX) is estimated to be about 4% of the CAPEX (i.e. $3.2 million). The construction period of the plant is three years. Total production of Methanol is 0.1095 million metric tons (MM-MT) per year. The investor is expecting 15% ROR. The contract duration for all calculations is assumed to be five years.
null
Base year and ROI approach
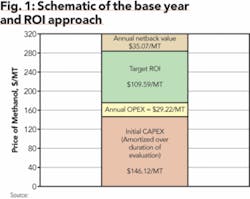
This method involves calculating the base NBV using an engineering/economic assessment of costs and product revenues in a base year. The base year is referred to as the first year of production. The costs will include CAPEX and OPEX (inclusive of transportation costs).
The Return on Investment (ROI), also referred to as Accounting Rate of Return (ARR), is calculated by dividing a proposal’s annual net income by either the total or the average initial investment outlay. There are many variations of these methods in literature and textbooks. Therefore, just referring to the return as ROI or ARR could be misleading and open to interpretation by the recipients.2-4
Mathematically, the NBV for this method (in the base year) is given by the following equation (all variables are in $/MT in the base year).
NBV = Price of methanol - CAPEX - OPEX - Target ROI(1)
The target ROI for this case (based on investor’s desired ROI of 15% and investment of $80 million) is $12 million per year. The CAPEX is also amortized over the duration for which the NBV is desired (five years in this example). The detailed calculations are shown in Table 2 and schematically illustrated in Figure 1.
null
Base year and ROR approach
This method is also based on the base year concept, i.e. basing calculations on the information of the first year only. However, it uses the time value of money concept to arrive at the NBV.
It is worth mentioning here is that there is difference between ROI, ROR, and Internal Rate of Return (IRR). The ROI or ARR are undiscounted methods and the IRR (same as ROR) are typically discounted methods. The IRR/ROR is typically defined as the discount rate that makes the net present value (NPV) of the investment’s net cash-flow equal to zero. It is recommended to always use IRR/ROR as these terms are widely used and understood in the industry.
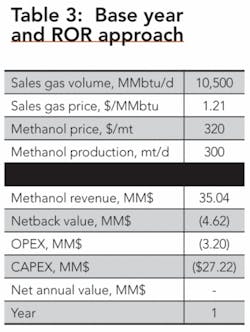
The calculations for this method are shown in Table 3. The CAPEX over the 3-year construction period is rolled into its equivalent annual value based on the investor’s expected ROR of 15%. These calculations are shown below.
CAPEX value at the beginning of year 3 (base year-first year of production) is first calculated as shown below.
The above CAPEX is then converted into its annuity (EAV), using investor’s expected ROR of 15%, for the period over which the netback value is desired (i.e. 5 years in this example).
The NBV is now determined, iteratively, using the Goal Seek function of ExcelTM. The objective is to search for the sales gas price (Row 2) or NBV (Row 7) that will make the net annual value equal to zero. The NBV so calculated is $4.62 million. Alternatively, the netback value can also be calculated directly using the following equation.
Where
P = price of methanol (product) in base year, $/MT
Q = volume of methanol in base year, MM-MT/year
Therefore, using Equation (2), the NBV is:
These calculations are schematically illustrated in Fig. 2. The OPEX, CAPEX, and NBV are converted to $/MT by dividing each by the annual methanol production in MM-MT.
null
Long-run marginal cost approach
The long-run marginal cost (LRMC) is defined as the total cost, per unit of incremental production, required by an investor to produce and deliver a unit of product into the market. In this article it is referred to the cost per unit of production regardless of incremental or existing units.
If the LRMC of a product is below the prevailing market price for the product then it is economical to produce this product and vice versa. This implies the minimum methanol price, at the start of the construction of the methanol plant, required to provide the investor’s minimum desired ROR (i.e. discount rate at which the project’s net present value becomes zero).
The calculations are based on a detailed cash-flow of a project, a cash-flow that is typically required for assessing the economic viability of a project. Therefore, it may be after-tax or before-tax, it may include adjustments to CAPEX, OPEX, price of product to reflect cost increases over time and so on. The cash flow may also incorporate financing if the project is supposed to be financed. If after-tax LRMC is desired then any type of allowable depreciation scenario can be included in the cash-flow.
The LRMC is typically calculated by dividing the present value (PV) of OPEX and CAPEX by the PV of the product stream. The present value of each variable is calculated at the investor’s desired ROR at the inception point (time zero) of the project.
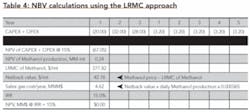
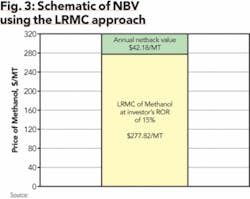
To determine the NBV of methanol using this method, LRMC of methanol’s production is calculated without the cost of the sales gas (feedstock). The difference between the market price of methanol and LRMC is the NBV. The detailed calculations for this case are shown in Table 4 and schematically in Fig. 3.
null
The NBV calculated using the LRMC approach (in Table 4) is exactly the same as that calculated using the EAV approach (Table 3). This is because the costs, methanol price and methanol volume etc. are all constant in both cases. The results will not be the same if any of these variables varied over time, i.e. costs were escalated, unless all numbers are converted to their equivalent annual values.
The NBV can also be calculated using Equation (3), the equation also accommodates increase in price of methanol over time.1
where
PtQt = annual gross revenue of methanol (product)
in year t, MM$
Qt = annual volume of methanol (product) in year t, MM-MT
ROR = discount rate (investor’s desired rate of return)
T = time horizon for development of the project as well as production life
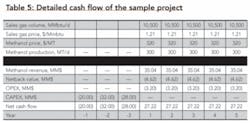
The NBV can also be determined by using the Goal Seek function of ExcelTM. The detailed cash flow for the sample methanol project is shown in Table 5. The Goal Seek can be performed to Set the NPV cell (Row 10, Col. 2 in Table 3) To Value 0 (zero) by changing the sales gas price (Row 2, Col. 5) if the NBV in Row 7 is connected to the sales gas price or the NBV (Row 7, Col. 5). The sales gas price or the NBV in year one is connected with the respective cells from year two to the end of project evaluation life.
Advantages and disadvantages
Some advantages and disadvantages of the three methods are presented below.
1. Base year and ROI approach
a. Does not account for the time value of money.
b. Assumes constant cash receipts and disbursements over time.
c. The ROI is not comparable with the cost of capital of the investor.
d. The method looses accuracy if after-tax NBV is required, unless straight line depreciation and fixed tax rate is used for the duration over which the NBV is desired. The income-tax significantly affects the sales gas price. For example, using the LRMC approach, the before-tax sales gas price drops from $4.24/MMBTU to after-tax sales gas price of $1.92/MMbtu (based on 35% tax rate and 10-year straight line depreciation).
e. The method cannot be used to calculate NBV if the investment is debt financed.
f. Will not be able to account for any escalations in product prices or costs. The costs should be escalated in order to reflect the increasing trend over time.
g. The method will not reflect major equipment replacements or upgrades during the duration over which the calculations are performed.
h. Detailed cash-flow has to be developed when incorporating the above variations. Aver age of each of the variables, presented above, may be used in the base year but it will further reduce accuracy. The main attraction of the base year estimates is to avoid detailed cash-flow. However, once the detailed cash-flow is developed then the LRMC approach can be used, which gives a more realistic NBV.
1. Base year and ROR approach
a. Accounts for time value of money.
b. Detailed cash-flow is required when the variables are expected to change as discussed above. All variables have to be converted to their annual equivalent values at the investor’s desired ROR. Simple averaging will affect accuracy.
1. Long-run marginal cost approach.
a. This is the most recommended approach.
b. The method is flexible so, any scenario of cash-flow can be easily accommodated.
c. The after-tax LRMC is calculated by dividing the PV of CAPEX, OPEX, and income tax by the PV of product volumes.
d. Detailed cash-flows are normally available for a new project, NBV calculation can be integrated into the same worksheet.
Interpretation of NBV and LRMC
It has been observed in day-to-day operations that the NBV and LRMC are sometimes misinterpreted. Some of these misinterpretations could be very detrimental to product and feedstock pricing or they could be simply embarrassing.
1. The NBV is the maximum amount the investor can afford to pay for gas. The gas supplier can negotiate a price between the LRMC of his gas and the gas price derived from the NBV. In this example, $4.62 million per year (equivalent to $1.21/MMbtu of sales gas) is the maximum amount the investor can afford to pay to the gas producer for feedstock/sales gas.
2. The NBV is mistakenly referred to as the price of sales gas, feedstock and fuel. As show in Figs. 1 to 3, it is actually the cost of feedstock (in terms of the product’s volume) to the investor. The price of sales gas, feedstock etc. is calculated from the NBV using Equation (4), same as Equation (3) but the denominator is replaced by the present value of the volume of gas supplied.
3. The price of sales gas in a contract based on netback pricing is usually indexed to the product pricing (it is called Indexed Netback Pricing). In this way both the gas producer and investor share the incremental benefit due to increased product price. The sharing is negotiated at the contract stage, say 30/70 split between producer and investor. If the price of methanol in the second year increases to $340/MT ($20/MT increase) then the incremental $20/MT of methanol will be allocated $6/MT to the gas producer and $14/MT to the investor. This will increase the NBV from $42.18/MT (4.62 MM$) to $48.18/MT (5.28 MM$). The corresponding sales gas price this year will be, using Equation (4), $1.38/MMbtu as compared to $1.21/MMbtu.
4. The netback method will include a “floor” to ensure that the value of the produced gas never goes to zero. The floor will be determined by the cost of producing the gas, typically the LRMC of the gas producer. The LRMC of gas producer should be inclusive of all costs and any expected increases in these costs over time.
5. The duration of calculations has significant effect on the NBV, hence the feedstock price. For example, increasing the duration of the examples above from five to twenty years will increase the price of sales gas from $1.21/MMbtu to $4.50/MMbtu.
6. The IRR, ROR, ROI etc. typically refer to return only on initial (upfront) capital investment (CAPEX) not operating costs. Operating costs are part of the net annual benefits calculation.
7. Some analysts recommend differentiating between peak and off-peak pricing for feedstock or fuel supply, i.e. to add capacity charge to the gas sold in the peak season. This recommendation is related to incremental cost associated with construction and operation of providing sales gas supplies during peak season. This may not be necessary if prices are based on LRMC of gas supplier.
a. Producer has surplus supplies. His LRMC is most likely based on design capacity and average gas supplies to other customers. The same or similar level of prices will be charged to the new customer.
b. Producer develops dedicated incremental supplies. In this case the LRMC of the incremental supplies will be inclusive of peak plant capacity costs and average gas supply volume over the year. Any price equal to or above the LRMC will already include the capacity charge and no additional charge will be required.
References
1. Siddayao, Corazon Morales, Is the Netback Value of Gas Economically Efficient? OPEC Review, September, 1997.
2. Mian, M. A., Project Economics and Decision Analysis - Vol. I: Deterministic Models, PennWell Publishing., © 2002, pp. 261-262.
3. Stermole, Franklin J. and Stermole, John M., Economic Evaluation and Investment Decision Methods, 10th Edition, Investment Evaluations Corp., Lakewood, Colorado, USA, © 2000, pp. 480-482.
4. Newendorp, Paul and Schuyler, John, Decision Analysis for Petroleum Exploration, 2nd Edition, Planning Press, Aurora, Colorado, USA, © 2000, pp. 18-21.
About the Author
M. A. Mian ([email protected]) is Engineering Specialist in the Upstream Ventures Department with Saudi Aramco in Dhahran, Saudi Arabia. He has more than 25 years experience in evaluating multi-billion dollar oil and gas projects. He is a registered professional engineer in the state of Colorado and holds a BSc degree in mechanical engineering, MSc degree in petroleum engineering, and MSc degree in mineral economics from Colorado School of Mines, Golden, Co. Mian is the author of four books “Petroleum Engineering Handbook for the Practicing Engineer, Vol I and II” and “Project Economics and Decision Analysis, Vol. I and II,” published by PennWell Books, Tulsa, Okla.


