North American liquids production will reach 8 million bbl/d by 2020
Per Magnus Nysveen, Rystad Energy, Oslo, Norway
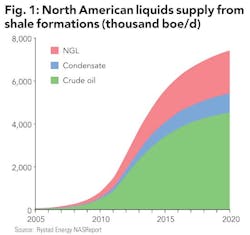
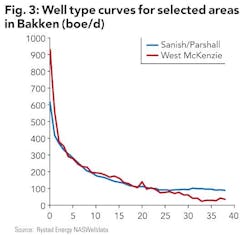
Liquids production (oil, condensate, and natural gas liquids) from North American shale formations (includes tight oil plays) will most likely reach 8 million barrels per day by 2020, assuming current activity levels will remain constant and only minor changes will occur to the latest reported performance of wells and fleets. (See Figure 1.)
As of April 2013, North American tight liquids production has reached 3 million barrels per day, up 1.1 million barrels over the last 12 months. NGL contributes 25% to the current tight liquids production.
During 2012, the Bakken shale play alone added 200,000 barrels per day to production totals; the Eagle Ford shale added 400,000 bbl/d; and Permian Basin plays added 200,000 bbl/d. Canadian plays contributed 70,000 bbl/d, and other plays added 300,000 bbl/d to the total for North America.
Future production growth will gradually be reduced by about 30% per year because a larger share of new production will be balanced by a decline from producing wells. Spending on drilling and completion will approach $100 billion during 2013 and possibly stay at this level for several years.
The three largest plays – the Bakken, Eagle Ford, and the Permian – will contribute 60% of the overall risked production potential for US and Canada tight liquids. The Eagle Ford will become the largest contributor, followed closely by the Permian plays in Texas and New Mexico. Each of these plays is expected to outperform the Bakken before 2020 when NGL production is included.
The most significant emerging plays, in order of production potential as gauged by current development activity are: Niobrara, Mississippian Lime, Anadarko tight oil (Panhandle oil plays), Utica, and Woodford. In these emerging plays, spending on new wells is estimated to increase in 2013 by more than 30% in the Mississippian Lime and by more than 50% in Niobrara compared to 2012 levels, based on the latest company guidance and estimates by Rystad Energy.
In Canada, the highest potential appears to be from the Duverney, Cardium, Montney, Bakken, and Alberta Bakken, in that order of precedence when looking at 2020 liquids potential.
Bakken
Production of light oil from the Bakken and Three Forks tight formations in North Dakota reached 705,000 bbl/d in December 2012. About 20,000 bbl/d on average was added every month in 2012. 1,866 wells were completed in 2012 with an average initial production rate of 730 boe/d during the first 24 hours. Production from new wells amounts to about 90,000 bbl/d every month, of which about 70,000 bbl/d is needed to offset the decline from producing wells.
Completions in November and December fell from 175 to 140 wells per month due to winter storms. This will translate to lower production rates in the first quarter of 2013, as evidenced by a 32,000 bbl/d decline in production reported in January. However, the backlog of completions should not last beyond Q2 given that the industry reports available pressure pumping fleets. Therefore, production trends should catch up during Q2 and stay strong throughout the year, as indicated by February net additions reported at 42,000 bbl/d, which is a new record for the play.
Rystad estimates that Bakken oil production will reach an average of about 750 bbl/d in 2013, including Montana, an increase of 130,000 bbl/d year on year.
Wells in the Bakken produce at relative high rates where the formation is particularly deep (more than 8,500 feet) and where thermal maturity is relatively high (above 0.9), thus favorable for pressure buildup from gas expulsion. Such conditions exist in the western parts of North Dakota.
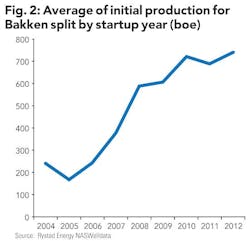
Typical IP rates in Williams, McKenzie, and northwest Dunn are about 1,200 boe/d for long laterals (Brigham, Hess). In the eastern parts of the play, the Middle Bakken formation is relative thick (up to 75 feet) and local presence of sweet spots with permeability up to 0.15 millidarcy in the Sanish/Parshall area also gives high production rates but also lower decline rates than in the high pressured and tighter rocks of the western parts of the play.
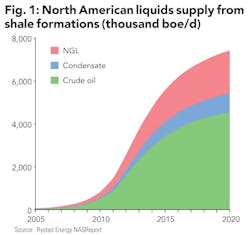
Consequently also in Montreuil, IP rates are up to 1,200 boe/d for the longest laterals, but valuation per well is potentially higher here due to lower decline rates and higher EUR. By looking at normalized well production rates from official production data, we observe the longer tail for wells in the Sanish/Parshall area after two years of production. Artificial lift by pump jacks also contributes to keep the tail relatively flat as modeled by hyperbolic decline curves. (See Figures 2 and 3.)
Eagle Ford
The most prospective zone of the Eagle Ford in terms of liquids production rates is the transition zone between the deep gas plays in the south and the more shallow oil plays in the North. Too far south, the hydrocarbon content is too low in condensates, and too far to the north the formation pressure is not sufficiently high to give profitable production rates.
EOG Resources has a very impressive acreage position in the sweetest part of the oil window. The eastern part of EOG's high productivity zone is better than the western zone, driven by both thicker spots and slightly deeper oil window in Karnes and Gonzales counties.
The Eagle Ford produced an average of 900,000 boe/d in 2012, and the current growth rate is 22%. The oil content is 52%. For 2013, Rystad estimates average oil production from the play of 750,000 bbl/d, and $20 billion will be spent on new wells during the year, a similar spending level as for the previous year.
Permian plays
Unconventional resource plays in the Permian Basin can be grouped into two areas, the Delaware sub-basin and the Midland sub-basin. The Bone Spring sand formations are the primary target in the Delaware basin in New Mexico, whereas in Texas the primary target is Wolfcamp shale horizontal wells. The Wolfcamp formation is also the primary target in the Midland basin, either commingled with Spraberry in vertical wells or drilled separately by horizontal wells in the southernmost counties (Reagan and Upton).
During 2012, the rig count for horizontal oil wells increased from 75 to 125, whereas for vertical wells it dropped from 275 to 200 in the Permian unconventional plays. Permian Midland produced 270,000 boe/d on average during 2012, and Permian Delaware 170,000 boe/d.
The oil content in both basins is around 65%, and the current growth rate is about 60%. For 2013, Rystad estimates the Permian tight oil plays combined will produce around 500,000 bbl/d of crude oil and condensate, and about $15 billion will be spent on new wells, an increase of 20% year over year on spending levels for drilling and completion.
Learning curves
During 2012, there was a significant improvement of drilling efficiencies as companies moved from drilling to hold leases to more optimized pad drilling. The average number of days from spud to spud in the Bakken decreased from an average of 30 days to 20 days during 2012. Significant efficiency gains were also reported in the Permian and Eagle Ford plays.
The active rig count for horizontal oil wells increased from 500 to 650 over the first half of 2012 and has now dropped back to 600. Thanks to increased drilling efficiency, the number of new wells is forecast to increase from 17,000 to 19,000 during 2013.
Breakeven prices
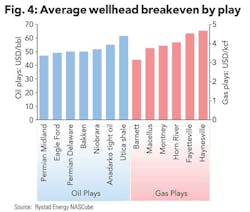
Value creation and profitability of the various plays is best expressed by comparing realized prices with breakeven prices (i.e., the minimum realized price that ensures positive net present value at 10% discount rate for new wells). The distribution of breakeven prices and production levels for every single well within a play is used to estimate the marginal cost of supply and robustness in activity levels when realized oil or gas prices are falling, such as we saw for the Bakken Clearbrook crude benchmark during the first half of 2012.
In the Bakken we observed that rig counts contracted when realized Bakken prices approached $60 per barrel during the first half of 2012. In the Bakken, Rystad estimates that about 90% of the new production comes from wells with breakeven oil price better than $60 per barrel. (See Figure 4.)
About the author
Per Magnus Nysveen is senior partner and head of data analysis for Rystad Energy. He joined the firm in 2004. He has particular expertise as an upstream portfolio and transaction advisor as well as wide experience with financial and fiscal regimes globally. He has developed comprehensive models for production profile estimations and financial modeling for oil and gas fields. Nysveen has 20 years of experience in risk management and financial analysis. He holds an MSc degree from the Norwegian University of Science and Technology and an MBA from INSEAD in France.
About Rystad Energy
Rystad Energy is an independent oil and gas consulting services and business intelligence data firm offering global databases, strategy consulting, and research products. Rystad has headquarters in Oslo, Norway, with additional offices in London, New York, Houston, Moscow, and in India. The firm is fully owned by the management. The views and opinions expressed in this article are based exclusively on the author's own analysis and assessments.
