Forecasting shale oil production
Per Magnus Nysveen, Rystad Energy, Oslo, Norway
Shale oil production in the US and Canada added one million barrels to domestic production over the last year. Current activity may bring North American shale oil supply from 3.5 million to 8 million barrels per day before 2020 (see OGFJ, May 2013). Such rapid growth from new oil wells has not been seen since Saudi Arabia increased its oil production capacity in the early 1970s.
The timing for the world economy is ideal: the global oil supply balance was stretched to its limits in 2007-2008; Saudi expansion since then has mostly been to balance decline from northern Ghawar, and BRIC demand and Iraq supply now appear increasingly fragile. We believe the world would be headed into an oil-driven recession without the North American shale oil revolution.
In order to make an accurate forecast for shale oil production, we need to assess the profitability of every existing well and future well location, and to make forecasts of the industrial capacity to drill and complete new wells on the prospective acreages. Three different types of information are needed: detailed geology of the target formations; empirical production data at well level; and company budgets and spending plans.
Play analysis
The key subsurface parameters determining profitability for shale oil plays are: hydrocarbon content (total organic content, thermal maturity, gas/oil/water saturation), formation structure (folds, faults, natural fractures), "frackability" (silica/calcite, minimum stress planes), formation pressure (depth, gas expulsion, pressure gradient) and "drillability" (hardness/integrity/pressure of the target formation and shallower packs). Some parameters have large variability over the acreage area (thickness, depth, thermal maturity, structures), other parameters vary more vertically (TOC, silica/calcite), and some parameters are more formation-specific with less local variations (kerogen type, depositional environment).
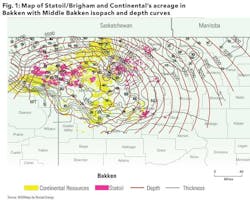
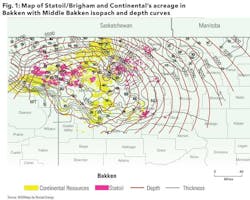
Figure 1 shows the horizontal distribution of two key parameters for the Bakken: thickness and depth of the Middle Bakken. Combined thickness of the Bakken/Three Forks is also a key factor. Sweet spots in the northern and eastern parts of the play (Mountrail County) are primarily driven by thickness, whereas depth and pressure (high thermal maturity, gas expulsion) contributes to a larger extent to the high production rates observed in the western part of the play,
Well curves
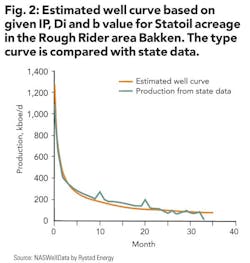
Shale oil wells typically decline 10% to 15% faster than shale gas wells over the first year (Fig 2). In the high-pressure zone of the Bakken, decline rates above 90% over the first year of production are common. But since the decline is also highly hyperbolic, the ultimate reserves can still correspond to more than 500 days of the initial production rate. Artificial lift by using pump-jacks also contributes to long flat tails as the downhole pressure falls. Hyperbolic decline curves, with IP from 400-2,000 boe/d, Di from 2-5% per day and b values of 1.5-2.5 fits nicely with most normalized curves from wells within one specific area, and the fit improves when adjusting for the number of stages. The discounted net present value for the wells and the acreage is highly sensitive to small variations in these parameters. The shape parameters are also strongly correlated; a high IP typically implies a high initial decline and also a higher hyperbolic b value. A detailed analysis of "heat maps" and empiric well production rates are crucial to achieve accurate forecasts. Rystad works bottom-up from individual wells for all shale analysis and pays close attention to individual subsurface characteristics and official production data.
In our analysis, we truncate the hyperbolic curves when the reserves reach a limit we feel confident about. This usually occurs after 10 to 30 years of production, depending on the maturity of the play and confidence provided by the empirical well data. The industry commonly applies a terminal constant decline rate of 5% to 10% per year. The time of transition between the initial hyperbolic shape and terminal exponential decline is a topic for debate. Also the fit of alternative curves, i.e. various versions of quasi-linear log-log curves, is also argued by academics (Duong method). It is worthwhile to note the physical justification for the two different regimes (hyperbolic, exponential), i.e. transient dominated flow (pre bubble point) and boundary dominated flow (post bubble point) in oil plays, corresponding to free gas versus absorbed gas in gas wells. Both in the Bakken and Marcellus, the transient phase is considered to last more than five years, thanks to overpressure and gas saturation in the Bakken and the presence of a matrix of natural micro-fractures in the Marcellus. In reality, the flow pattern will be a combination of both regimes, and the transition will happen gradually; also the physical effect of artificial lift is poorly documented by shale oil decline analysis. However, a constant b value over the life cycle is an over-simplification and forecast models should allow adjustments for this in the tail-end phase.
IP learning curve
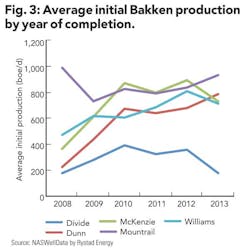
Bakken statistics show an average increase of 24-hour initial production rates from 600 to 800 boed/d over 2009-2012 as the completion techniques were fine-tuned (Fig 3). The average number of stages increased from 19 to 27 over the same period, while the average rate of production per stage decreased from 36 to 25. Also, the frack intensity for each stage and the fracking pressure increased, proppants and fluids were improved, and accurate microseismics provided better understanding of the fracture dynamics. The IP learning curve has now apparently peaked, the technology is optimized, and some of the sweetest locations have already been drilled. Over 2012 and 2013, the average IP rate has decreased from 800 to 700 boe/d. The decreasing IP comes from down-spacing wells in the Mountrail (EOG), drilling on the shallower Bakken in the west (Continental), experimental wells in the deeper and high-permeability/low-pressure wells in the southern part of the play (Whiting). We expect IP rates to fall by 5% p.a. after the drilling activity peaks on the acreages.
Drilling schedule
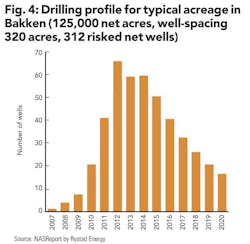
Once the various well-curves are established for the different portions of the acreage, we need to estimate the expected/risked well locations and a realistic drilling schedule (Fig 4). To determine the risking factor, we take into account average well spacing, acreage quality and diversity, share of proved to unproved well locations, absolute size of the undeveloped acreage, and overall development maturity of the play.
Base decline is determined from official data and in-house estimates. Company guiding and activity outlooks are considered for the estimate of well count for 2013, whereas from 2014 our own independent assessment takes precedence. Our consistent assessment on long-term drilling and completion activity on individual acreages depends on oil price assumptions, infrastructure constraints, financial capacity, and availability of rigs and of fracking fleets. Efficiency gains are considered to estimate well count and well costs for 2013, but not beyond. In the Bakken the average spuds per rig-year have increased from 9 to 15 wells per year as operators move from exploratory drilling and HBP drilling into pad-based development drilling. Also increased use of open-hole completions and sliding sleeves in the Middle Bakken has reduced time to completion to a few days, whereas the traditional "plug & perf" operations typically last for a week on cemented long laterals.
About the author
Per Magnus Nysveen is senior partner and head of data analysis at Rystad Energy. He has 20 years of experience within risk management and financial analysis. He holds an master's degree from the Norwegian University of Science and Technology and an MBA from INSEAD.
