New friction factor derived from study of Egyptian gas-field pipeline
N. El-Emam
Al-Azhar University
Cairo
F.K. Gad, A. Safwat Nafey
Suez Canal University
Suez, Egypt
N. Zoghaib9545jel01.gif 9545jel02.gif Evaluations of a newly developed friction-factor equation (and hence a new gas-flow formula) indicate that it produces higher accuracy than all equations currently in use.
Balayim Petroleum Co.
Cairo
Further, the new equation can be conveniently used to optimize operating conditions of any existing gas pipeline or aid in designing new, similar gas pipelines.
Study to develop the equation was based on the data collected from the 22-in., 40-km, natural-gas pipeline connecting Abu Madi gas field in the north of the Nile Delta to the natural-gas national grid at Talkha (flow-rate range of 3.5-6.5 million std. cu m/day [scmd]), in addition to other short gas lines of gathering systems.
The most common gas- flow equations available in the literature (Weymouth, Panhandle A, Panhandle B, and AGA) were checked against measured field data.
The results show a noticeable error percentage in the case of the Abu Madi to Talkha pipeline: Panhandle B was the most accurate equation followed, in order, by Panhandle A and Weymouth. The least accurate was the AGA equation.
To obtain better accuracy, 14 explicit friction-factor equations were also checked because the main difference between the gas-flow equations can be attributed to the type of the equation used for friction-factor determination. All of these equations proved to be less accurate than Panhandles B and A.
The evaluation of the new equation showed it to be more flexible in accommodating many ranges of flow rate by developing the relevant new constant related to gas flow rate.
The proposed new equation can be used to estimate the effect of any variable on gas flow in a horizontal or inclined system in addition to facilitating the optimum design of any new gas pipeline.
Gas in Egypt
The history of natural gas in Egypt began in 1967 when the international Egyptian Oil Co. (IEOC), subsidiary of the Italian oil company AGIP, discovered Abu Madi gas field in North Delta, about 10 km south of the Mediterranean Sea coast.In 1969, Phillips Petroleum Co. discovered Abu Quir marine field. In the same year, Gulf of Suez Petroleum Co. (Gupco) discovered Abu El-Gharadiq gas field in the Western Desert. And, in 1978, the Naf marine gas field was discovered north of Alexandria.
Later, other gas fields were discovered and put into production, such as El-Qara (north of Abu Madi), Abu Sanan, Badr El-Din 1 and 2/3. Other older gas fields, such as Port Found, are being developed and will be put on production shortly.1-5
To preserve the position of Egypt as an oil-exporting state, the Egyptian petroleum sector adopted a policy governing the replacement of petroleum by natural gas and encouraging exploration and development of new gas fields.
Because of the increasing importance of natural gas to the Egyptian economy, the petroleum sector has begun rapidly to expand development of gas fields and give priority to exploiting associated gas instead of flaring it.
Additionally, the petroleum sector is implementing projects for gas-gathering systems and consolidating transportation on the national-gas network.
As a result, Egyptian production of natural gas (Fig. 1 [89,949 bytes]) has been increased threefold within 10 years. Because the study being reported here was conducted in Abu Madi field, the progress of natural-gas production by Abu Madi field is also shown in Fig. 1.
Initially, natural gas was used only where it was produced, with excess production being vented or flared. This was also especially true for associated-gas production in oil fields.
Gas transportation
The growth of natural-gas applications has spurred both the demand for natural gas and development of the technology required to produce and transport it.Transportation has an important role in the natural-gas industry as consumption centers are usually far from producing wells. Today, this transportation is achieved mainly by large-diameter pipelines (12-48 in.) with pressures typically ranging 700-1,200 psia.
Different gas-flow equations which can be used for gas-pipeline calculations are available in the literature. Because these equations differ in their accuracies, the main objective of the present research was to compare among these equations to select the most appropriate for Nile Delta gas lines.
Achieving this objective involved the following:
- The study was conducted on a natural-gas pipeline network at Abu Madi field, the first and largest natural-gas field in Egypt and a part of Nile Delta fields. Abu Madi field lies 10 km south of the Mediterranean Sea near Gamasa (Fig. 2 [121,200 bytes]). The study dealt with the gathering system connecting Abu Madi wells to Abu Madi manifold and the natural-gas pipeline connecting Abu Madi plant to the natural-gas national grid at Talkha (namely Abu Madi to Talkha gas pipeline). The specifications of Abu Madi wells are given in Table 1; the 40-km Abu Madi to Talkha gas-pipeline specifications have a nominal 22-in. OD, a 0.5334-m ID, and a surface roughness of 0.061 x 10⁻³ m.
- Field data collected included gas flow rate (Q) inlet and outlet pressures (P1 and P2), inlet and outlet temperatures (T1 and T2), and gas specific gravity.
- Different statistical analysis methods were used to make the comparison among the most accurate equations: Weymouth, Panhandle A, Panhandle B, AGA). These methods were error percentage, absolute average deviation, standard deviation, and variance.
- Different computer programs were prepared especially for this study. Without such programs, the comparisons could not have been done.
The COL program checks the accuracy of the explicit equations proposed to solve the implicit equation of Colebrook and White concerning the calculation of friction factor.
KNEW calculates the different values of the constant (k) pertaining to the proposed equation. In addition, it checks field data on turbulent flow after calculating Reynolds number values.
The parts of field-data reading, constants statement, units conversion, and Z-factor calculations, are identical to those of GAFLEQ program. Then, the actual transmission factor "1/ ' / f" was calculated based on the measured field data using the general flow equation.
Following is the proposed equation:
1/ ' / f = k log [(6.9/Re)2.8 + (d/3.7)3.108] (1)
where:
k = Constant related to flow rate.
As the target here is to correlate k, the values of actual transmission factor 1 ' / f were divided by the quantity:
log[{6.9/Re)2.8+
(d/3.7)3.108] (2)
The result will be the accurate value of the constant k. The obtained values of "k" were compared with other operating parameters to find the appropriate correction form.
Effects of flow rate, temperature
To evaluate the effect of gas flow rate (Q) on the pressure drop and the deviation of each concerned equation from the measured values, the gas mean temperature must be kept constant. This is accomplished by representing the flow-rate values vs. relevant values of error percentage within a certain range of gas mean temperature (TM).To draw the group of curves in question, all the data points were divided into three ranges of gas mean temperature that cover all the obtained values of gas mean temperature pertaining to the concerned pipeline: T1 = 24-27° C.; T2 = 27-29° C.; and T3 = 29-35° C.
Fig. 3 [65,373] illustrates such comparison at the mean temperature ranges 24-27° C. Similar figures can be drawn at the other selected mean temperatures.
This figure, and the similar ones, support the following observations:
- The most accurate equation among the four is Panhandle B, followed by Panhandle A, Weymouth, and AGA, respectively.
- The error of the four equations increases with increasing flow rate.
- The rate of error change with flow rate change, represented by curve slope, is higher in the case of Weymouth and AGA than for Panhandle B and Panhandle A. The rate is higher for AGA than for Weymouth and for Panhandle A than for Panhandle B.
To draw the group of curves in question, all the data points were divided into six ranges of flow rates to cover the operating flow rate of the observed pipeline: Q1 = 3.5-4.0 million standard cu m/day (MMscmd); Q2 = 4.0-4.5 MMscmd; Q3 = 4.5-5.0 MMscmd; Q4 = 5.0-5.5 MMscmd; Q5 = 5.5-6.0 MMscmd; and Q6 = 6.0-6.5 MMscmd.
Different curves can be illustrated, each at one of these flow-rate ranges. Fig. 4 [54,245 bytes] is an example, from which the following observations can be made:
- No definite relationship was obtained between the change in TM and the accuracy of the applied equations. This may be due to the poor effect of TM on equation accuracy or to the short applied range of TM.
- For the same range of flow rate, the order of accuracy pertaining to the applied equations is the same as stated earlier: Panhandle B gives the least while AGA produces the highest error percent.
Actual, calculated pressure
The importance of this type of comparison is that it helps in evaluating the accuracy of any equation.This can be done by drawing a line inclined at a 45° angle, representing the case in which the measured values are equal to the calculated values. The nearer the calculated points of any equation approach this line, the greater the equation's accuracy and vice versa.
Fig. 5 [74,790 bytes] gives an example of such curves. This figure and others show the accuracies of the investigated equations, which were in fact unsatisfactory. Therefore, a more-accurate equation was sought.
New equation
The investigation clearly indicated that the end-line pressure calculated by any of the investigated four equations is less than the corresponding measured one.To look for a better accuracy than those obtained by the investigated four equations, 14 explicit equations (A1 through A14) which were proposed to solve the well known Colebrook implicit equation, were checked.6-9 (See accompanying box.)
Table 2 presents the obtained errors for these equations as an example of their accuracies. The relevant average value of error percentage for each equation was calculated in each temperature range and then for all points together.
Among all the 18 equations evaluated, Panhandle B has been the most accurate when compared with field data. As highly accurate gas equations mean highly optimum pipeline design, the need is always pressing for a more-accurate gas equation.
Consequently, trials were intensified to obtain a more-accurate equation. These trials, performed in this study, made good use of data-fitting methods and the forms of the previously published equations which have been checked.
The trials resulted in the proposed equation that proved to be more accurate than any one of those checked in this study. Here is the procedure that led to the new equation, which is based on Colebrook's.
One of the proposed explicit equations to solve Colebrook's equation is Haaland's relation:7 1/ ' / f = 2 1.8 log
[( 6.9/Re) + e(/3.7d)1.11] (3)
Haaland then generalized this relation to
1/ ' / f= 2 1.8/n log [(6.9/Re)n + ((/3.7d)1.11n] (4)
For n = 1, Equation 4 is reduced to Equation 3.
Haaland suggested n = 3 yields friction factors in consonance with those recommended for use in gas-transmission lines. As our study has been applied on natural-gas transmission lines, the said recommendation of n = 3 is worthy of attention.
When Haaland's two equations were checked against measured field data, it was found that the error percentage in the case of n = 3 is lower than the case of n = 1 with only 0.1%.
Accordingly, study was directed to another way of improving the calculation accuracy recommended for natural-gas transmission lines.
Referring to the comments obtained from the curves relating the accuracy with operating parameters, it is found that the most affecting operating parameter on the calculation accuracy is the flow rate.
From this point, and with the help of data-fitting technique,10 a new equation was proposed: 1 ' / f = k log [(6.9/Re)2.8 + (e/3.7d)1.11*2.8] (5) where:
k = 2 0.91 for 5.5 < Q < 6.5 MMscmd
k = 2 0.834 for 6.5 < Q < 5.5 MMscmd
k = 2 0.79 for 3.5 < Q < 4.5 MMscmd
Equation 5, in conjunction with the general flow equation,11 produces the new gas flow equation.
In the new equation, n = 2.8 rather than 3, as recommended by Haaland. In addition, the constant (-1.8/n) is replaced by a value of k which is a function of flow rate. This means that the new equation takes into consideration the effect of flow rate on the calculation accuracy more than Haaland's two equations.
When checked against the measured field data, the new equation gives better accuracy than Panhandle B or Haaland's two equations, as shown in Table 3 as an example.
Fig. 6 [56,686 bytes] shows the relationship between the flow rate and error percent resulting from Panhandle B and the new proposed equation at T1, as an example. This figure indicates that, while Panhandle B gives negative error percent in all cases, the new proposed equation produces negative and positive values around zero.
Fig. 7 [61,620 bytes] illustrates a cross plot of the actual and calculated end line pressure by the proposed equation in comparison with Panhandle B (the best published one). From this figure, one can see the better accuracy of the new proposed equation than that of Panhandle B (as well as all the other investigated equations).
References
- Katz, et al., Handbook of Natural gas Engineering, McGraw Hill Book Co., New York, 1959.
- EGPC Annual Report, 1985-1994.
- Petrobel Magazine, No. 5, July 1989.
- Petrobel Magazine, No. 3, March 1995.
- Petrobel Magazine, No. 4, April 1994.
- Ouyang, L.B., and Aziz, K., "Simplified equation predicts gas flow rate, pressure drop," OGJ, May 8, 1995, p. 70.
- Zigrang, D.J., and Sylvester, N.D., "A Review of Explicit Friction Factor Equations," ASME Journal of Energy Resources Technology, Vol. 107, June 1985, pp. 280-283.
- Churchill, S.W., "Friction Factor Equation Spans all Fluid Flow Regimes," Chemical Eng., Vol. 91, Nov. 7, 1977.
- Zigrang, D.J., and Sylvester, N.D., "Explicit Approximations to the Solution of Colebrook Friction Factor Equation," AIChE Journal, Vol. 28, No. 3, May 1982, pp. 514-515.
- Holman, J.P., Experimental Methods For Engineers, Sixth Edition, McGraw Hill Inc., 1994.
- Szilas, A.P., Production and transport of oil and gas, Part A, Eisevier, 1985, Chapter 1.
The Authors
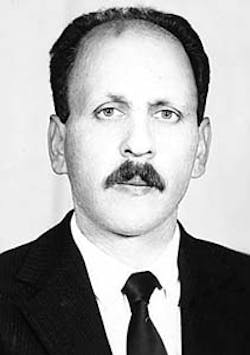
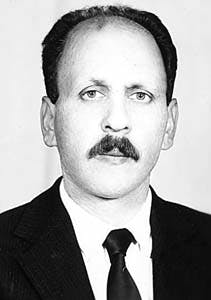
N.A. El-Emam is professor of petroleum engineering at Al-Azhar University, Egypt. He holds BS and MS degrees from Al-Azhar University and a PhD from the Technical University of Heavy Industries, Hungary; all the degrees are in petroleum engineering.
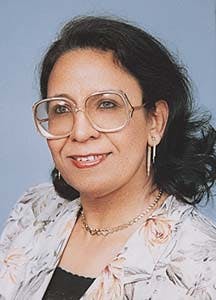
Fatma K. Gad is an assistant professor in the faculty of Petroleum and Mining Engineering, Suez Canal University, Suez, Egypt. She holds a BS in refinery engineering from the Institute of Petroleum & Mining Engineering and both MS and PhD degrees in chemical engineering from Manchester University, England.
Ahmed Safwat Nafey is a lecturer in the faculty of Petroleum and Mining Engineering, Suez Canal University, Suez, Egypt. He received BS and MS degrees in mechanical engineering from Mansoura University, Egypt, and a PhD in mechanical engineering from Leeds University, U.K.
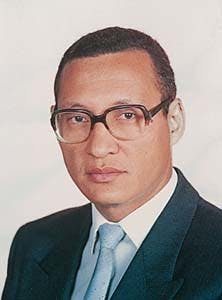
Nasser Zoghaib is section head at the mechanical division in Belayim Petroleum Co. (Petrobel), Nile Delta fields in Egypt. He has been working there for 9 years following 2 years as a maintenance engineer in a textile company. He received a BS (1985) in mechanical engineering from Ain Shams University, Cairo, and an MS in petroleum refining engineering from Suez Canal University, Suez. He is an assistant member in the ASME and a member in the Egyptian Society of Egyptian Engineers.
Copyright 1997 Oil & Gas Journal. All Rights Reserved.
