Neural network model predicts naphtha cut point
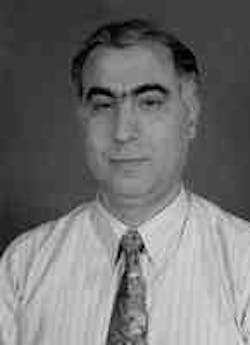
Issam WadiAbu Dhabi National Oil Co. (Adnoc) developed its own neural network model to estimate the quality of an important intermediate product of crude fractionation.
Abu Dhabi National Oil Co.
Abu Dhabi
Test results of the refiner's in-house neural network (NN) model showed the model to be more accurate than on-line analyzers 82% of the time.
A typical modern oil refinery spends more than $10 million to acquire on-line analyzers, and more than $0.5 million/year to support them. Using NN technology to replace conventional on-line analyzers could reduce capital and operating costs by replacing hardware with a computer model.
It is not within the scope of this article to explain in detail the derivation and use of neural networks-that has been done elsewhere.1-4 The results shown here, rather, will illustrate the successful use of neural networks in a refinery setting.
Neural networks
NN theory was first launched in the early 1950s as a result of joint work between mathematicians and neurophysiologists. Several theories and NN technologies have emerged since then, many of which have resulted from research in universities and industries.
NN theory is based on an attempt to emulate the human brain. NN is like a human brain in that it uses available data and association to solve problems; hence, NN is nonprocedural in its approach. This differentiates it from other conventional artificial intelligence and procedural programming techniques.
Fig. 1 [93763 bytes] illustrates the structure of the human brain, which is composed of neurons connected to one another by synapses and axons. Based on the collective effect of all the inputs to a neuron, it either fires or does not.
When a brain neuron fires, an electrical pulse of certain characteristic is sent to other neurons connected to it. Neural networks work in a similar way.
A simple NN usually is made of several layers: input, output, and at least one hidden layer. Fig. 2 [138610 bytes] illustrates a simple NN comprising three layers.
The neurons are connected to one another as shown. Each connection has a "weight."
Adequate data are needed to train an NN model. These data are presented to the NN model, which undergoes a learning process by trying to adjust the weights of the different connections until the error value between its desired output and actual output is equal to or less than a certain predefined level.
Why use NN?
Refineries and petrochemical plants use laboratory and on-line analyzers to determine the qualities of important streams. On-line analyzers provide data that help monitor and operate plants safely and optimally.
But these analyzers are expensive to buy and maintain. And their reliability generally is moderate.
Laboratory analyses are performed less frequently, and so cannot be relied on to monitor and control a plant continuously.
Most advanced control and optimization applications use quality analysis in their models. The reliability of on-line analyzers is a hindrance to improving the benefits achieved from using these applications. So operators use inferential techniques to supplement them.
Inferential techniques typically are based on empirical, inferential equations that need extensive effort to build, tune, and maintain. This is especially true when the process design is changed substantially.
Near-infrared analysis is an example of a common analytical technique that uses inferential calculations to determine stream quality. Neural networks perform a similar, inferential function.
Neural networks use different transfer functions to convert input values into output values. Examples of such functions are ramp, sigmoid, and linear functions.
A threshold value is set to determine the firing level of each neuron. Equation 1 describes the basic equation of firing for a neuron.
Model development
Neural network models are developed using an NN engine and relevant training data. Many configuration options and design features are available to NN engineers. These need to be configured to suit the addressed problem.
Examples of these design features are:
- NN architecture
- Number of layers
- Number of nodes in each layer
- Training rate
- Momentum
- Threshold value.
The collected data are divided into two categories: training data and testing data. The training data need to be representative of the problem and adequate in number. Regression techniques sometimes are used to verify, screen, and prepare these data for NN training.
Training is stopped when the NN model converges to certain present threshold values. The model is then tested using the test data. The model parameters are then tuned to improve the results.
Backpropagation
The backpropagation (BP) algorithm was developed by Stanford Professor David E. Rumelhart in the late 1980s. It was an extension of the least mean square (LMS) algorithm.
This algorithm was popular because it could overcome the limitations of previous NN algorithms.
BP network concept
To build a BP network, a minimum of one input layer, one or more hidden layers, and one output layer is needed. Each neuron is connected to every neuron in the next layer.
The output of a neuron is calculated as shown in Equation 2. In BP networks, the error is backpropagated from the output layer to the input layer using Equation 2.
The objective of this technique is to reduce the global error between the desired output and the actual output by adjusting the weights in each pass until a certain level of training error is reached. The weight is changed according to the size and direction of the negative gradient on the error surface (Equation 3).
Global error is defined by Equation 4.
NN applications
In the 1980s, several attempts were made to apply NN technology in industrial settings. The automotive, medical, manufacturing, and power industries were among those that tried these applications. But few attempts were made in the oil industry.
The author, however, has used neural networks to perform "on-line" analyses of product quality in a refinery setting.
Adnoc applied NN to determine the 95% cutpoint of the naphtha side stream from the crude distillation unit. Ordinary process measurements were used to build the model.
The author developed the NN model based on the principles described earlier. It was "trained" using process measurements, corresponding on-line analyzer readings, and laboratory analyses of the 95% cutpoint for this stream.
Model building
The author began building an NN model by selecting: process data related to crude tower operation, the corresponding daily laboratory analyses, and the hourly output from the naphtha 95% distillation-point analyzer. The process data were collected as hourly averages from the DCS system, while the laboratory data were collected from the laboratory information system.
Backpropagation NN was used to generate the models. This procedure was performed on a 486 DX2, 33-Mhz computer.
Initially, the NN model was trained using a large number of process measurements. The model was tested using actual process measurements and laboratory analyses, but it did not produce good results.
A screening step reduced the number of input variables to 11. Multiple regression techniques and the author's expert judgment were used for this purpose. The 11 input variables chosen represent the best-correlated qualities and measurements.
Examples of variables used are: top temperature, column pressure, gas oil flow, kerosine pumparound flow, crude density, and reflux flow. Adnoc considers the full list of variables proprietary.
Data collected during a 2-month period were used to train the model. After the model was trained, it was tested using process and analyzer data. (To make the test fair, the test data were not included in the training data set.)
Table 1 [9548 bytes] and Fig. 3 [52173 bytes] show the results of testing two NN models (ANN-1 and ANN-2) against 2 months' analyzer data.
To develop the second, improved model, data from a 4-month period were merged, and the number of input variables was reduced to six. The selection of these variables was based on expert judgment and on the results of the first model.
The revised model then was correlated only to the results from 4 months' data from the laboratory analyses. The revised model corresponded closely with the laboratory analyses (Table 2 [7435 bytes], Fig. 4 [53422 bytes]).
The two models are based on the same training data but use different NN tuning parameters, such as training rate, momentum, threshold values, and number of hidden nodes. Table 3 [5777 bytes] shows the differences between the tuning parameters used for ANN-1 and ANN-2.
Throughout the training phase, several model architectures and tuning parameters were tried. The results were improved noticeably as a result, and the training time was reduced substantially.
The average training time for the above models was 35-44 hr.
Observations
The author reached the following conclusions about the NN model:
- The model produced reliable and accurate results, based on 4 months of process data.
- The model results trended well with the laboratory data.
- The difference between the NN models and the laboratory results was, in 82% of cases, smaller than or equal to the difference between the results from the corresponding analyzer and the laboratory results for the same sample.
The NN models proved to be more reliable than the on-line analyzer. A comparison of the results from the analyzer, laboratory, and NN models for the test set of naphtha 95% cut point measurements showed average differences of:
- 3.4° C. between the analyzer and the laboratory results
- 1.84° C. between the ANN-1 model and the laboratory results
- 1.28° C. between the ANN-2 model and the laboratory results.
This is a good indication of the accuracy of the NN model. (Note: These data were calculated after all the suspect laboratory and analyzer data were removed.)
The outcome of this preliminary experimental work is promising, and should motivate industry and academia to pursue this scheme further. Based on these results, the use of NN models to replace conventional on-line analyzers can reduce the capital and operating expenses associated with product quality monitoring.
Bibliography
1. Aleksander, Igor, and Soston, Helen, Introduction to Neural Computing, Chapman & Hall, U.K., 1991.
2. Kosko, Bart, Neural Networks and Fuzzy Systems, Prentice-Hall International, New Jersey, 1992.
3. Vemuri, V. Rao, Artificial Neural Networks, IEEE Computer Society Press, California, 1992.
4. Kartalopoulos, Stamatios V., Understanding Neural Networks and Fuzzy Logic, IEEE Press, New Jersey, 1996.
The Author
Issam Wadi is engineering and automation division manager for Abu Dhabi National Oil Co. He has 20 years' experience in instrumentation, information systems, and automation in the oil and gas industry. He is a member of the Instrumentation Society of America, Institute of Electrical & Electronic Engineers, and the Jordan Society of Engineers.
Wadi has a BS in control systems from Ain Shams University in Cairo, a postgraduate degree from the University of Wisconsin, and is working on a PhD in neural network applications in association with the University of Strathclyde, Glasgow.
Copyright 1996 Oil & Gas Journal. All Rights Reserved.

