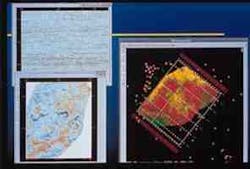
APPLIED GEOPHYSICS 3D survey combines acquisition, processing, interpretation
Peter M. Duncan, Eric B. Gardner, Douglas C. NesterForty years ago, advancements in computing technology split reflection seismology into three distinct, specialized disciplines: acquisition, processing, and interpretation. Today, technological breakthroughs in exploration and production software and hardware are bringing the geophysical disciplines back together, but on a higher plane.
3DX Technologies Inc.
HoustonJay E. Valusek
Landmark Graphics Corp.
Houston
This year, in the first known project of its kind, a multidisciplinary team headed by 3DX Technologies fully processed, interpreted, and imaged an onshore 3D seismic survey during data acquisition, cutting the typical cycle time nearly in half. Significant changes to the survey design took place while the crew was still in the field, dramatically improving data quality and coverage without incurring any stand-by costs.
The survey took 11 days to shoot. A day after the last shot was recorded, processing was finished. Within a week, the subsurface interpretation (in depth), reservoir volumetrics, and economic analysis were complete. The first well was selected at a partner's meeting a week later. To date, a multiwell program has been completed, and the process worked out in this pilot project has since been applied to other 3D surveys commissioned by 3DX and its partners.
Real-time imaging
Prior to the dawn of the E&P Information Age in the 1950s, a single geoscientist-known literally as a "computer"-acquired, processed, and interpreted seismic data right in the field. By day, he laid out the survey and supervised the shoot. At night, he processed analog shot records on film, marked reflectors of interest, plotted each trace on paper, drew rough cross sections, and looked for highs to recommend for drilling.
This quick, low-tech methodology succeeded in locating large structural traps. But the subsurface images it produced were far too crude to identify smaller traps and subtler geologic features.
In the late '50s and early '60s, researchers devised new ways of converting analog seismic records into digital form, filtering out noise and false reflections, and enhancing the signal using room-sized, number-crunching computers. To do this, however, oil companies had to pull the processing sequence out of the field, severing the former link between data gathering and interpretation.
While digital technology produced much clearer seismic images of the earth, the long and tortuous chain of events required to turn field data into drilling decisions often resulted in ambiguous interpretations and, ultimately, dry holes. Long after the survey crew had left the field, seismic interpreters often found that data resolution was insufficient, or survey parameters were incorrect. Sometimes a tantalizing lead would appear at the edge of the survey. But remobilizing the crew and reshooting was extremely expensive and time-consuming.
Not only do long turnaround times impact the quality of the technical evaluation, they also tie up large amounts of money for long periods without any payoff. It is not unusual, for example, for a large 3D survey to take a year or more to acquire, process, and interpret. Drilling wells and bringing them on stream takes even longer.
Shortening the overall cycle time would significantly increase the rate of return on investment. Even if a particular prospect proved uneconomic, it would be better to find out early and move quickly to another project without wasting resources.
Project Doodlebug
Five years ago, Landmark published a white paper predicting the reunion of seismic processing and interpretation, due to rapid advancements in computing technology.
"When interactive processing and interpretation merge seamlessly at the desktop, it will be possible once again to interpret seismic data during acquisition," the paper said. "... No longer will a single 'computer' do it all. Rather, multidisciplinary E&P teams, perhaps linked by satellite and modem, will plan each stage of acquisition by shooting, processing, and interpreting concurrently.... They will cut not only days or weeks from an exploration or development project, but months...." 1
3DX Technologies, which spun off from Landmark several years ago, further developed this vision and decided to make it a reality. 3DX envisioned a continuous "data pipeline" extending all the way from the seismic recording truck in the field through processing and on into an interpretive workstation, where a 3D image of the reservoir would be updated in real time with each shot.
Because computing power has grown exponentially in the 1990s, seismic processing now can be done rapidly and inexpensively on the desktop. Today, instead of waiting until a 3D survey has been shot, then batch-processed for weeks or months before an interpreter ever sees it, the entire job can be processed overnight while the acquisition crew is still on location.
To test this vision of real-time seismic imaging, 3DX began looking for the right 3D survey. The ideal prototype-dubbed "Project Doodlebug"-would be relatively close to Houston, to get data to the processor and interpreter quickly without the need to worry about satellite links or moving people, hardware, and software to the field. Also, the survey area would be small, and it would have a simple, fairly shallow structure, to avoid bogging down the interpretation. Nevertheless, because 3DX is a high-tech oil company, not a research organization, the prospect had to have real economic potential.
Last fall, a small independent approached 3DX seeking technical support for a deal in South Texas that provided a perfect opportunity to test the Project Doodlebug concept. Discovered in the late 1950s, the field has produced over 50 bcf of gas from shallow, flat-lying Miocene sands.
Deposited in a near shore environment characterized by barrier bars, tidal channels, and chenier plain facies, the sands exhibit only minor compaction faulting along an elongated, low-relief, northeast-southwest anticline. Structurally, the play was ideal for Project Doodlebug. In addition, the field was located only 3 hr away from Houston by road.
Most of the successful wells in the field had been drilled early. For example, one well made over 14 bcf from a sand near 5,000 ft. Most operators over the years had been unable to locate channel sands and bars with any degree of accuracy. Approximately 30 wells had been drilled, but only 7 had been completed and only 2 were still producing. Prior to this project, only a few lines of 2D seismic had ever been shot.
The geophysical challenge, therefore, was to design a 3D survey that could resolve channels and barrier bars approximately 300 ft wide at three stratigraphic intervals vertically separated by less than 100 ft, at a depth of less than 5,000 ft.
Integrated work flow
Prior to shooting of the 3D survey, the project geologist had correlated most of the well logs by hand. To create the digital database, existing tops, log curves, and velocity data from wells within the survey area were digitized and loaded into a UNIX workstation running Landmark geological interpretation and mapping software. Additional log correlations and cross sections were done on the system, and the initial geologic model was created by mapping three key horizons.
Synthetic seismograms were generated to determine what seismic frequencies were necessary to resolve the top and bottom of individual sands in the target interval. An empty 3D cube was created onscreen with all of the subsurface data in it, waiting to be filled with seismic information, integrated, and visualized each day as the survey proceeded.
Permitting on the 19 sq mile survey began early in 1996. The survey crew and line cutters moved in to lay the grid a few weeks later. The recording crew and trucks mobilized to the site a little more than a month after that (Fig. 1 - below).
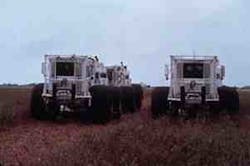
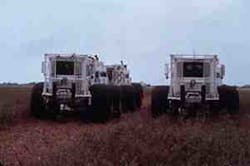
Vibrator trucks, rather than dynamite, provided energy for the 3D survey to provide control over the source and the higher frequencies needed to image the target sands (Fig. 1).
Despite shooting on a wet, grassy strand plain, vibrators were used rather than dynamite to control the source and obtain higher frequencies needed to image the sands. Vibrator trucks were mounted with sand tires and GPS (global positioning system) units to help operators navigate better. The first shot records were taken at 5 p.m. on a Sunday, 2 days after the crew arrived.
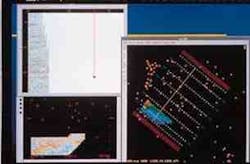
At noon the second day of the shoot, the first 130 shot records left the site for Houston by truck. Upon arriving at 3DX about 3:30 p.m., the records were loaded into Landmark's 3D seismic processing system on a Silicon Graphics Power Challenge with two CPUs. The shot records went through geometry verification, decon testing, velocity analysis, stacking, and time migration. By 4 a.m. the next day, the data had been stacked and migrated four different times to get the parameters right. At about 7 a.m., the final time-migrated data were loaded into a Landmark geophysical workstation as a 3D cube and time-sliced. By 11 a.m., the data were interpreted and tied to the well database (Fig. 2).
Stacked and migrated data from the first group of shot records were time-sliced, interpreted, and tied to the well database by 11 a.m. of the third day of the seismic shoot (Fig. 2).
Initially, three horizons were picked and mapped. The geophysicist called the field before noon and informed the crew that the area had been satisfactorily shot and that they could pick up the geophones. At that point, the next set of shot records left the site for Houston. The same procedure was repeated every day for the next week and a half.
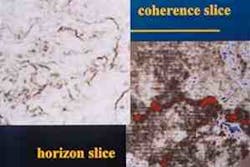
Each day, between 100 and 200 shots were added to the survey, and the new, enlarged dataset was completely processed through migration before the next morning. Several different seismic attribute volumes were generated, including coherency, which helped image channel sands (Fig. 3).
As shooting progressed, the growing dataset was processed daily through migration. Processors generated several seismic attribute volumes, including coherency (Fig. 3).
Besides the three key horizons picked each day, several intermediate horizons and five sequence boundaries were autotracked, to aid correlation. Pseudo-check shots were created in wells with sonic logs to adjust velocities. New maps were created, and data quality was confirmed before the crew was allowed to forge ahead. With each pass, processing parameters were adjusted and more-accurate interpretations achieved. Surface consistent statics were added to the processing flow the fourth day of the shoot, FXY deconvolution following migration the eighth day, and a refraction statics solution the twelfth day.
Milestones
One of the questions Project Doodlebug was designed to test was how well the field crew could respond to real-time changes in survey parameters. On Wednesday, the fourth day of the survey, a structural anomaly began to appear within the dataset, too close to the edge to be imaged properly. After another day of shooting, the decision was made to extend the survey by 1.5 sq miles to close off the anomaly.
By Friday, seven agents were knocking on doors in the area to start obtaining the necessary permits, and surveyors began laying out the additional lines. This real-time design change was one of the most significant achievements of the new integrated work flow.
Another major change took place a week after the survey began. As the crew approached a low-lying bayou area near the shoreline on the northeast boundary of the field, the interpreter noticed that the frequency content of the data began to drop below the level necessary to image the target sands. He radioed a request to the field to add 25 shots (five racks) to the existing grid to try to clean up the image.
Using the GPS units on the trucks to steer the vibrators to station, the crew began shooting the extra points within an hour of the request. Because of the improvement seen in the next day's processing, this double sweep was used in swampy areas elsewhere in the survey.
By Tuesday, the tenth day of the shoot, permitting of the 1.5 sq mile extension was complete. On Wednesday evening, acquisition of the main grid was complete. The whole extension was shot Thursday. The extra data shot in this area were sufficient to close off the structure.
The interpretation, begun during acquisition, continued for a week afterward, during which the prospect was completely qualified, volumetrics were calculated, and economics analyzed. During the survey, approximately 1,700 shots and 725,000 traces had been recorded, successfully imaging the target sands just above 5,000 ft (Fig. 4).
Interpretation began during acquisition and continued for a week afterward, successfully imaging the target sand (Fig. 4).
Human, technical factors
A number of factors, both human and technical, enabled 3DX to successfully complete this experiment in real-time seismic imaging.
One factor was the speed and efficiency of acquisition today. Not only are survey crews much faster than they used to be, but aerial photography and navigation with GPS technology yield more accurate geometry control in the field. Also, by collecting more data per day, there is sufficient information to produce a significant seismic image early in the process to facilitate decision-making.
Perhaps the most obvious factor is very fast, extremely cost-effective 3D seismic processing on powerful desktop systems. Instead of getting a box of tapes at the end of the survey, the 3DX team got a completely processed dataset. In fact, by the time the job was finished, the entire dataset had been processed 17 times.
The whole economics of processing is changing. Now, it makes more sense from a cost standpoint to process a dataset all the way through migration as you acquire it-even if it is incomplete-rather than sit on it until every last trace has been recorded. This improves not only processing parameters in real time but also field acquisition parameters, as this case study demonstrates.
Also, an integrated geoscience interpretation system enabled the team to analyze and visualize the subsurface quickly enough to keep pace with both acquisition and processing. The geologist and seismic interpreter worked on two networked systems, running nine Landmark applications, many of which shared a common Oracle database. The whole Doodlebug concept depends on the ability to share data easily among numerous software tools. The tighter the integration of both data and applications, the more likely a multidisciplinary team will be able to work in real time.
Finally, a key factor in this project's success was the flexibility and commitment of all the people involved. Team members had to be ready at a moment's notice to change plans, make decisions on the spot, and trust one another's judgment. The project proceeded 24 hr/day until it was complete. Not only did the urgency of the process keep everyone's creative energies extremely focused on the same problem at the same time, but it maintained a level of enthusiasm rarely experienced in the industry today. One team member said the project was "a hell of a lot of fun-one of the most exciting things I've ever worked on." Another said, "This is the only way to do it. We should work like this on every single project."
Results
Technically, this project successfully implemented a number of important aspects of the Project Doodlebug vision. It proved that the seismic processor could cope with the daily production of a typical land 3D survey. The geologist and seismic interpreter were able to evaluate the data effectively on a daily basis and contribute directly to the survey's design. And the recording crew was able to respond to a dynamically designed survey without sitting idle at any time.
In the process, a high level of data quality was achieved, and the usual cycle time for such a project was reduced by an estimated 50%. Drilling began less than 3 months from commencement of operations. The traditional approach might have required 6 months or more before the first well was spudded.
To date, a number of wells have been drilled in this South Texas field, a play that continues to develop. 3DX Technologies is applying this approach to larger land 3D surveys elsewhere along the Gulf Coast. In addition to processing the dataset through time migration as in this project, plans include processing through full 3D depth migration.
Implications
Real-time seismic imaging dramatically shortens overall cycle time and gets the drill bit into the ground sooner. This process has significant business implications.
For one thing, shorter cycle times may provide better and cheaper access to land. Most landowners would rather see the work done faster. If they know an operator will make its drilling decision in half the usual time, they may be more willing to sell the lease, quite possibly at a lower price.
More importantly, the internal rate of return on a project can be demonstrably increased by shortening the cycle time. Money is not tied up for years awaiting production. Cash flow begins much sooner than in traditional projects. Even if a particular prospect proves uneconomic, finding out quickly means the project can be terminated and valuable resources assigned to more profitable endeavors.
Productivity increases because the same E&P professionals can complete more projects in the same overall period of time.
Finally, by focusing the brainpower of an entire multidisciplinary team on solving a common problem, real-time imaging yields higher quality recommendations and, ultimately, better business decisions.
Acknowledgments
The authors wish to thank Tony Dawlearn of Geovision, who did the processing; Party 22 of Veritas Energy Services, who acquired the 3D survey; and Brenda Hagan of 3DX, who provided technical assistance to the interpretation team.
Reference
1. "The Coming Reunion of Seismic Interpretation & Processing," white paper, Landmark Graphics Corporation, November 1991.
The Authors
Peter M. Duncan is co-founder and vice-president of technology for 3DX Technologies Inc. He holds a BS in physics and geology from the University of New Brunswick and master's and PhD degrees in geophysics from the University of Toronto. His 20 year career has included assignments with Shell Canada, Digicon Geophysical, and Landmark Graphics.
Eric B. Gardner is a senior explorationist with 3DX Technologies. He holds a BS in physics from the Colorado School of Mines. His 12 year career has included assignments with Marathon and Amoco.
Douglas C. Nester is co-founder and vice-president, exploration, of 3DX Technologies. He holds a BS in geology from the University of Pennsylvania and performed graduate studies in stratigraphy at the University of Houston. He also holds an MBA in finance from the University of St. Thomas. His 17 year career has included assignments with Pennzoil, ExploiTech, and Landmark Graphics.
Jay E. Valusek is senior writer with the corporate communications group of Landmark Graphics Corp. He has published dozens of articles about computer-aided exploration and reservoir management technology around the world. Prior to joining Landmark in 1988, he worked as a reservoir development geologist with Pennzoil. He holds an MS in geology from Colorado School of Mines.
