TECHNOLOGY Leak detection by mass balance effective for Norman Wells line
Jim C. P. Liou
University of Idaho
Moscow
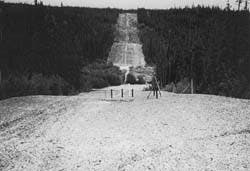
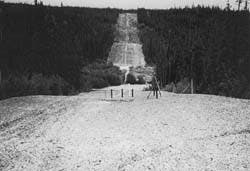
Portions of the pipeline right-of-way along IPL's Norman Wells pipeline are covered with wood chips to insulate the slope and prevent permafrost thawing. Also shown are groundwater drains and temperature-sensing pipes.
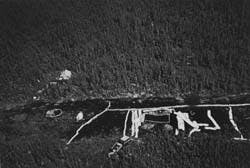
An oil-spill exercise (mid-1994) in a remote, sparsely populated area along the Norman Wells pipeline right-of-way shows weighted booms deployed along a creek. (No oil was present in the water or on the surrounding land.)
Mass-balance calculations for leak detection have been shown as effective as a leading software system, in a comparison based on a major Canadian crude-oil pipeline.
The calculations and NovaCorp's Leakstop software each detected 4% (approximately) or greater leaks on Interprovincial Pipe Line (IPL) Inc.'s Norman Wells pipeline (Fig. 1 [80869 bytes]). Insufficient data exist to assess performances of the two methods for leaks smaller than 4%.
Pipeline leak detection using such software-based systems are common. Their effectiveness is measured by how small and how quickly a leak can be detected. Algorithms used and measurement uncertainties determine leak detectability.
Mass balance rationale
Consider an intact pipeline that transports one or more petroleum products batches. During a time interval (Dt), the measured inflow mass may be unequal to the measured outflow mass. The discrepancy is attributable to uncertainties in flow measurements and to estimates of mass stored in the pipeline (that is, linefill).
Expressing masses as volumes at a standard condition of 1 atm and 15o C. and including the uncertainties, the principle of conservation of mass is stated in Equation 1. (See accompanying equations box.)
In Equation 1, a root sum square (RSS) process is used to combine independent uncertainties.1 A leak is likely to be detectable when its size equals or exceeds the combined uncertainties in flow measurements and in linefill changes during a time interval.
Therefore, the size of the minimum detectable leak (Q l ) can be obtained from Equation 2.
Flow measurements at the pipe inlet and outlet are made with equipment of known uncertainty. For each measurement, this uncertainty can be expressed as a fraction (k) of a reference flow rate (Qref; such as the throughput of the pipeline) in standard volume per unit time.
Thus, dQm can be expressed by Equation 3 in which the subscripts "in" and "out" denote the k values of the flow meters at the inlet and the outlet of the pipeline. Since the uncertainties in the flow measurements are independent of each other, the RSS process is used to estimate the most probable uncertainty in dQm.
Linefill uncertainty (dVs) is estimated from the equation relating linefill to pressure and temperature and from uncertainties in pressure and temperature. Linefill can be expressed by Equation 4.2 The definitions and magnitudes of CT and F can be found in ASTM and API, respectively.3 4
Divide the pipeline into n segments according to batch boundaries and other system features. Suppose that pressure and temperature measurements are made for each segment. Let dP and dT be uncertainties in pressure and temperature for each segment.
The upper bound of uncertainty in linefill change can be expressed by Equation 5.2 In this equation, the derivatives are evaluated at the average pressure and temperature for the pipe segments.
Absolute values of the derivatives for petroleum products and for crude oil can be found2 for ranges of fluid's specific gravity and pipe diameter to wall thickness ratio.
Note that dVs depends on dP and dT, which result from measurement nonrepeatabilities as well as from uncertainties in the state of flow. When unexpected transients occur, dP can be large.
Substituting Equation 3 into Equation 2 yields the minimum detectable leak, scaled by Qref, expressed by Equation 6. Thus, it is seen that Ql depends on Dt.
For a specified dVs, a smaller leak can be detected over a longer time period, with the combined flow measurement uncertainties forming the lower limit. For a large dVs or with a short time period, the minimum detectable leak is large and the uncertainties in flow measurements may not be important.
Plotting Ql/Qref against Dt results in a hyperbola that specifies the leak detectability of the pipeline.
Pipeline and instrumentation
IPL's Norman Wells pipeline is a 12.75-in. OD line with varying wall thicknesses that spans approximately 550 miles (868.9 km). Fig. 2 [29923 bytes] shows wall thicknesses and elevation profiles.
The main pump station is at Norman Wells at the pipeline inlet. Booster pump stations are located at Wrigley and Mackenzie. A receiving terminal is at Zama which terminates the line.
The pipeline transports light crude oil at a constant flow rate of about 250 cu m/hr (approximately 31,250 b/d). At the Norman Wells inlet, crude oil can also enter the pipeline at a side line near the Zama terminal.
Custody-transfer metering with dedicated provers is used at all inflow and outflow points. The unit weight of the crude oil at the standard conditions is 827.9 kg/cu m which corresponds to a gravity of 39.25o API.
Flows are measured by positive-displacement meters. The estimated accuracy for flow measurements is normally about 0.1%, although the maximum inaccuracy can be as great as 0.25%. The nonrepeatability is estimated at about 0.015%.
Pressure transmitters measure pressures at stations and at several valve sites. The performance specifications of the transmitters indicate an inaccuracy of 0.25% of span, which is 0-12,000 kPa(gauge) at all locations.
The stated inaccuracy includes the combined effects of nonlinearity, hysteresis, and nonrepeatability. Assuming equal effects among the three sources of inaccuracy, the nonrepeatability is estimated to be 17.32 kPa or 2.51 psi. The outputs from the transmitters are 4-20 ma analog signals.
Temperature measurements are made by 100 R0 Platinum RTDs and temperature transmitters. The nonrepeatability of the RTDs is 0.025% of operating range or 0.05o C., whichever is greater.
Based on the specifications of the transmitter used, a nonrepeatability of 0.0625o C. or 0.113o F. was estimated. The outputs from the transmitters are also 4-20 ma analog signals.
All analog signals are digitized by remote terminal units (RTUs) using 12-bit converters. The supervisory control and data acquisition (scada) system polls the data from the RTUs at an interval of about 20 sec and converts them into physical units.
Time stamping occurs at the control center. Temperatures and flows are reported every scan. The pressure data are reported by exception using a dead-band of about 9 kPa (estimated from the pressure data). The converted temperature was rounded to the nearest 0.10o C.
Leak-test data
Five sets of results from simulated leak tests in terms of leak size vs. time of leak alarm (or warning) were provided by IPL. Similar results for nine additional tests were also available. These data are shown in Table 1 [21224 bytes].
The times shown under "Time to detect" were determined by NovaCorp's Leakstop transient model software. For the additional tests in the table, no data other than those shown were known. For these tests, the flows under the "Inflow" column are average line rates.
Operational data for the five leak tests were also made available. The data indicate the following:
- Aside from noise and changes resulting from a leak, the flow was essentially at steady state.
- The noise levels in both the pressure and flow were higher at Norman Wells because of the proximity to the pump station.
- Significant temperature variations occurred at Norman Wells.
- Variations in temperature were greater at Mackenzie station's discharge.
- Temperatures at the remote valve sites and at station suctions are essentially constant.
Bad pressure measurements at some remote valve sites were noticed. Consequently, only the measurements at the stations were used.
Pressure profiles along the pipeline were computed by matching the observed pressure drop between stations. The computation used the recorded flow rate, the pipeline elevation profile, and appropriate friction factors.
Temperature profiles were established with data at the stations and at the remote valve sites. The mean station pressure and temperature values for the five data sets are shown in Table 2 [22218 bytes].
Variable nonrepeatabilities
Data received at the control center can be used to establish variable nonrepeatabilities. Two sources contribute to measurement nonrepeatabilities, variations in the data, and rounding of each reading:
- Data variations include noise and unexpected or inexplicable changes. The flow is expected to be at a steady state in the mean; the standard deviation of a set of data can be viewed as a measure of data uncertainty.
- Rounding numbers results in uncertainty in the last digit of measurements, which are 0.1o C. for temperature, 1 kPa for pressure, and 0.1 cu m/hr for flow rate. Anticipated and explicable perturbations in the data were removed before computing the standard deviations.
The resulting value and the rounding error for the measurement are combined according to the RSS process to yield the nonrepeatability for that measurement.
Table 3 [15597 bytes] shows representative (Test A) nonrepeatabilities inferred from instrumentation specifications and from the measurements using the procedure just described. The subscripts "in" and "out" refer to the inlet and the outlet sections for the pipe segments.
Note that the nonrepeatabilities of the outlet temperature measurements are less than that estimated from the specifications of the temperature sensor and transmitter. This is due to filtering of data by the scada system.
Because of data noise and slight changes in the state of flow, the nonrepeatabilities for all the flow and most of the pressure measurements exceed those estimated from the specifications.
The nonrepeatabilities established from the measured data are preferred since the effects of scada system filtering, noise, and uncertainty in the state of flow are included.
Leak detectability
With the data in Tables 2 [ 22218 bytes] and 3 [15597 bytes] and the data base of absolute value of the rate of linefill change with pressure and temperature,2 six linefill uncertainties were established. With these uncertainties and the flow uncertainties shown in Table 3 [15597 bytes], six leak detectability curves are plotted in Fig. 3 [33683 bytes].
Also shown on the same figure are actual leak test results (Table 1 [21224 bytes]) using transient model-based leak detection software.
The test data points of detectable leaks follow the trend of the leak-detectability curves. The data point for C, based on a transient flow model, falls below the corresponding leak-detectability curve that is based on mass balance.
For D, the test data using the transient model fall only slightly below the detectability curve that is based on mass balance.
Tests A and B both fall below the prospective curves. Only warnings, however, not leak alarms, were issued by the transient model leak detector for these two tests.
The leak in Test E is easily detectable, as the data point clearly lies above its detectability curve. All the additional tests lie above the detectability curves associated with D and E.
These results suggest that the method of leak detection based on mass balance is realistic: it detected leaks of 4% (approximately) or greater as were also detected by NovaCorp's Leakstop software.
Data are insufficient to assess the relative performance of the two methods for leaks smaller than 4%.
It should be emphasized that variable uncertainties are not deterministic quantities. Standard deviations were used to establish measurement nonrepeatabilities.
Hence, it is possible that a detectable leak test data point falls below the corresponding detectability curve. However, such an occurrence is unlikely.
For qualitative estimations, if the frequency of uncertainties is normally distributed and the uncertainties are at twice the standard deviation, then the probability of detecting a leak underneath the detectability curve is less than 4.54%.
Leak detectability based on mass balance can be improved significantly if the pipe segments from Norman Wells to Wrigley, from Wrigley to Mackenzie, and from Mackenzie to Zama are considered separately.
The reason for the improvement is that linefill uncertainty is additive. When separated, each pipe segment has a smaller linefill uncertainty, which results in greater segmental leak detectability by mass balance.
Lack of flow measurements at Wrigley and Mackenzie in such an approach should not present a problem. The nonrepeatability of flow measurements at Norman Wells or Zama can be assumed at Wrigley and Mackenzie.
There are two justifications for this assumption:
- The flow was essentially at steady-state for the tests, and variations at different locations should be small.
- The position and shape of the leak-detectability curves are not sensitive to flow nonrepeatability until the leak size becomes very small.
Acknowledgment
D.M. Scott and L.M. Petherick of Interprovincial Pipe Line Inc. provided the data and their interpretations. Their help was indispensable in this study.
References
1. Scarborough, J.B., Numerical Mathematical Analysis, 5th Edition (Baltimore: The Johns Hopkins Press, 1962).
2. Liou, C.P., "Pipeline Variable Uncertainties and Their Effects on Leak Detectability," API Publication 1149 (Washington: American Petroleum Institute, Washington, 1993).
3. ASTM, API, and IP, Petroleum Measurement Tables-Volumetric Correction Factors, Volume X-background, Development, and Program Documentation, ASTM D1250, API Standard 2540, and IP 200 (Philadelphia: American Society for Testing and Materials, 1980).
4. Manual of Petroleum Measurements, Chapter 11.2.1M-Compressibility Factors for Hydrocarbons: 638-1074 Kilograms per Cubic Metre Range (Washington: American Petroleum Institute, 1984). Based on a presentation to Energy Week Conference & Exhibition, Jan. 29-Feb. 2, Houston.
The Author
Jim C. P. Liou is an associate professor in civil engineering at the University of Idaho, joining the faculty in 1986. He was a senior staff engineer with Stoner Associates Inc. 1979-1986 and an engineering specialist with Bechtel Inc. 1976-1979. He holds an MS from the University of Idaho (1972) and a PhD (1976) from the University of Michigan. Liou is a member of ASCE and ASME International.
Copyright 1996 Oil & Gas Journal. All Rights Reserved.


