E. Texas, Gulf Coast show gas-recovery growth
Play disaggregation reveals important growth trends for the major natural gas fields in the Texas Gulf Coast basin and East Texas.
Disaggregation by play unmasks important play-by-play trend variations in natural gas ultimate recovery growth that are obscured by aggregated analysis of broad geological provinces.
Significant growth is occurring, and certain plays hold greater future growth potential due to reservoirs that are in the early stage of development, are geologically/structurally complex, in tight gas/ low-permeability formations, or at greater depths.
Gulf Coast, East Texas plays
The Texas Gulf Coast bisin (Texas Railroad Commission Dists. 1, 2, 3, 4 and state offshore) and East Texas (RRC Dists. 5, 6, and northern portions of 3) are major natural gas producing provinces.
Texas accounted for 26% of 1997 U. S. natural gas annual production.1 Within Texas, the Texas Gulf Coast basin and East Texas account for 51% and 16% of annual natural gas production, respectively.
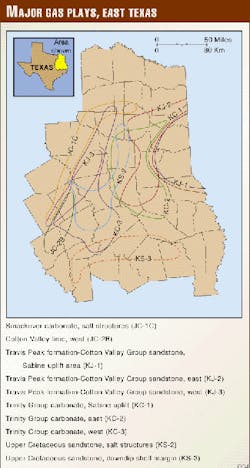
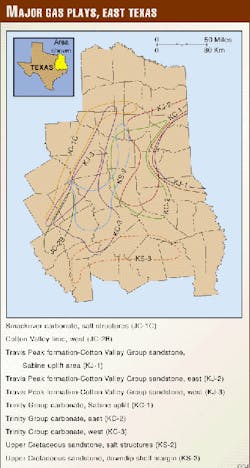
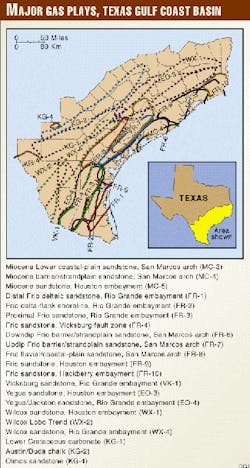
The U.S. Energy Information Administration's 1996 Oil and Gas Integrated Field File (OGIFF)2for the Texas Gulf Coast basin and East Texas was reduced into 1,369 and 246 major fields with significant ultimate natural gas recovery (1996 natural gas ultimate recovery estimates greater than 10 bcf and at least 2 years of data). Field-level ultimate recovery data were disaggregated into 21 and 10 geologically delineated plays, respectively, utilizing the Bureau of Economic Geology's Atlas of Major Texas Gas Reservoirs3 as the primary guide to play delineation (Figs. 1, 2).
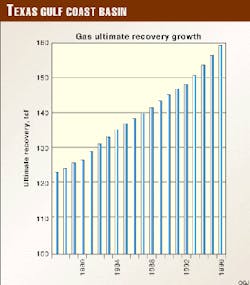
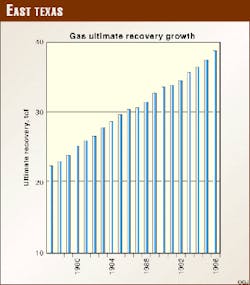
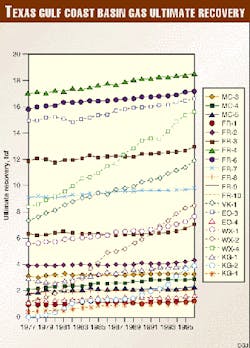
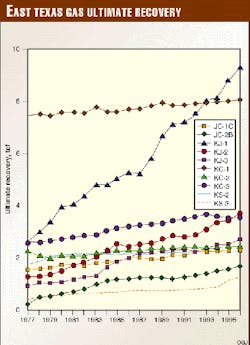
When taken as a total, major fields of the Texas Gulf Coast basin and East Texas are currently experiencing significant natural gas ultimate recovery growth activity. The Texas Gulf Coast basin and East Texas have shown ultimate recovery growth of 37 tcf and 19 tcf, respectively, attributable for the 20 years 1977-93 (Figs. 3, 4). However, important natural gas ultimate recovery growth activity is obscured or masked by such total, aggregated analysis. Certain plays in the Texas Gulf Coast basin and East Texas are experiencing significant natural gas ultimate recovery growth while others show little to no future growth potential.
Historical trends from 1977-96 in terms of annual natural gas ultimate recovery, production, and proved reserves revealed several distinctive trends. In particular, annual natural gas ultimate recovery for all Wilcox (WX) plays, the Vicksburg sandstone Rio Grande embayment (VK-1) play, and the Austin/Buda chalk (KG-2) play displayed significant growth trends in the Texas Gulf Coast basin (Fig. 5). For Fast Texas, all the Travis Peak formation-Cotton Valley Group sandstone (KJ) plays and the Smack-over carbonate, salt structures (JC-2B) play displayed significant growth trends (Fig. 6).
Plays WX-1, WX-2, WX-4, and VK-1 in the Texas Gulf Coast basin and plays KJ-1, KJ-2, KJ-3, and JC-2B in East Texas are comprised of relatively recently discovered fields. Although some of these plays have earlier discovered fields, a bimodal distribution exists in the field discovery history. Most of the current production and growth are coming from more recently discovered fields. Plays with less ultimate recovery growth than these plays tend to be comprised by older fields. Giddings field, discovered in 1960, dominates play KG-2.
Field depths of the major fields of the Texas Gulf Coast basin and East Texas generally fall within a range of 10,000-14,000 ft. Noticeable trends toward deeper fields were revealed in these plays. Deeper reservoirs tend to exhibit more complex structures and cementation. These factors contribute to reservoirs of these plays to display geological/structural complexities and reservoirs designated as tight gas/low-permeability formations.
Ultimate recovery growth study
Ultimate recovery growth analysis based on a factor of time and drilling activity was conducted for the Texas Gulf Coast basin and East Texas as whole provinces and also disaggregated by the major plays.
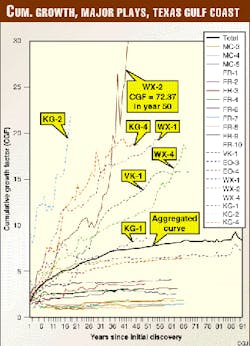
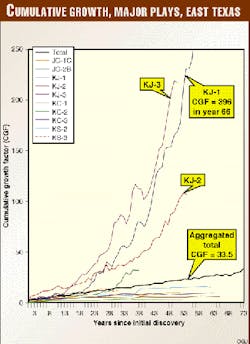
Previous natural gas ultimate recovery growth analysis based as a factor of time utilizing Arrington's methodology4of cumulative growth factors relied on assuming the same growth patterns would exist for all fields in the particular play. Cumulative growth curves for major plays in the Texas Gulf Coast basin and East Texas are shown in Figs. 7 and 8. In instances where only a few fields had complete data available from 1977 onward, the early trends of ultimate recovery growth for these few fields were extrapolated for the entire play.
Cumulative growth factors are very sensitive to the first few years of data. In order to avoid possible problems associated with the time dependent data, only the data frame from 1977-96 was utilized. A more accurate and recent natural gas ultimate recovery growth analysis based on time may be achieved by observing the percentage growth from 1977, the first year of data available from the OGIFF data base.
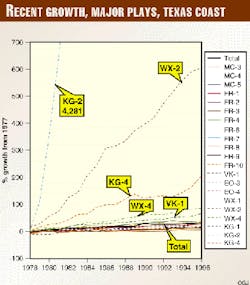
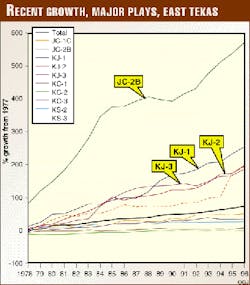
Recent natural gas ultimate recovery growth for the total major Texas Gulf Coast basin and East Texas plays has increased approximately 301/4, and 74%, respectively, within the 20-year time frame from 1977-96. For the Texas Gulf Coast basin, plays KG-2, WX-2, KG-4, WX-4, and VK-1 are showing the most recent growth in terms of percentage growth from year 1977 (Fig. 9).
Caution is advised for interpreting the results for the KG-2 play, since Giddings field dominates the ultimate recovery data. Plays JC-2B, KJ-1, KJ-2, and KJ-3 are showing significantly greater growth trends, while all of the Trinity Group carbonate (KC) plays are showing lower growth trends in East Texas (Fig. 10).
Ultimate recovery growth analysis by a factor of drilling activity also revealed significant growth occurring in the Texas Gulf Coast basin and East Texas.
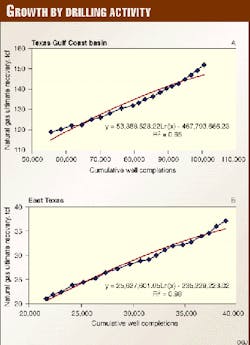
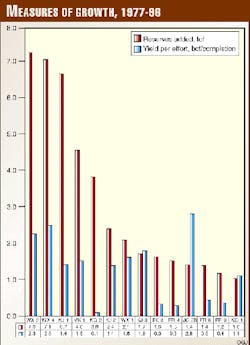
Natural gas ultimate recovery was plotted against cumulative well completions and fitted with a logarithmic best-fit line (Fig. 11). The slope of the curve represents the yield per effort. Yield per effort relying on only recent data and trends can be achieved by considering only data from 1977-96. When disaggregating yield per effort by plays in this method, Wilcox (WX) plays have the greatest yield per efforts in the Texas Gulf Coast basin. For East Texas, the Jurassic carbonate (JC) and Travis Peak formation-Cotton Valley Group sandstone (KJ) plays have significantly higher yield per effort in recent years compared with the Trinity Group carbonate (KC) and Upper Cretaceous sandstone (KS) plays.
Rankings of the top plays in terms of natural gas ultimate recovery growth and their associated yield per efforts are shown in Fig. 12.
Conclusions
Significant historical natural gas ultimate recovery growth and future potential in the Texas Gulf Coast basin and East Texas have been quantified, ranked, and forecast by plays both as a factor of time and drilling activity.
Undoubtedly, ultimate recovery growth is a large and crucial component in the future natural gas supply of the Texas Gulf Coast basin and East Texas, as well as for the entire U.S. Detailed studies and broader applications of ultimate recovery growth analysis are required and necessary to accurately assess this important resource component.
Future research directions include a play specific economic and technological analysis of currently selected major plays within the Texas Gulf Coast basin and East Texas. Natural gas ultimate recovery growth is slowly but finally being recognized as one of the most important components of U.S. future natural gas supply.5
Acknowledgments
Thanks to the U.S. Department of Energy for funding this project and to the U.S. Energy Information Administration for the data.
References
- Energy Information Administration, U.S. crude oil, natural gas, and natural gas liquids reserves; 1997 Annual Report, DOE/EIA-0216 (97), 1997, 158 p.
- Energy Information Administration, The 1996 Oil and Gas Integrated Field File, digital data file, 1996.
- Kosters, E.C., Bebout, D.G., Seni, S.J., Garrett, CM., Brown, L.F., Hamlin, H.S., Dutton, S.P., Ruppel, S., Finley, R.J., and Tyler, N., Atlas of maior Texas gas reservoirs, Bureau of Economic Geology, 1989, 161 p.
- Arrington, IR., Size of crude reserves is key to exploration programs, OGJ, Vol. 58, No. 9, 1960, pp. 130-134.
- Kim, EM., Natural gas ultimate recovery growth modeling by plays in the Gulf Coast basin, The University of Texas at Austin, 1998, 288 pp.
The Authors
Eugene M. Kim is a post-doctoral fellow at the Bureau of Economic Geology in Austin. He is involved in oil and gas ultimate recovery growth studies, play analysis, resource assessments, and economic evaluations. He holds a BSE degree in mineral and petroleum engineering from Seoul National University and an MS degree in energy and mineral resources and PhD degree in geological sciences from the University of Texas at Austin ([email protected]).
William L. Fisher is the Barrow chair in the Department of Geological Sciences and director ad interim of the BEG. He is a long time advisor to state and federal officials and a member of the National Academy of Engineering and National Petroleum Council. He holds BS and DSc (Hon.) degrees from Southern Illinois University and MS and PhD degrees in geology from the University of Kansas.
