U.S. pipelines experience another tight year, reflect merger frenzy
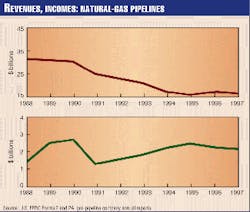
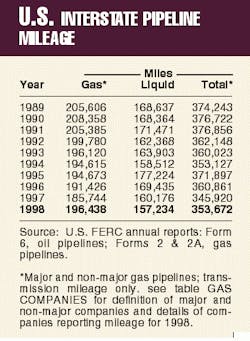
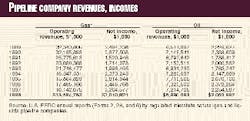
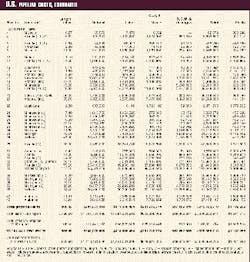
Federally regulated oil and gas pipelines, which comprise most of the systems moving hydrocarbons in the U.S., suffered another lean year in 1998, according to annual reports filed through mid-1999 with the U.S. Federal Energy Regulatory Commission (Fig. 1; Table 3).
And prospects for future profitability-or lack thereof-have driven several pipelines into each others' arms: Witness major mergers during 1998 among natural gas and oil pipelines.
Gas-pipeline construction applications to the FERC through June 30, 1999, indicated these same companies anticipated building fewer miles of pipeline in the near future. At the same time, these plans suggest companies expect the costs of installing new pipeline to moderate from recent years' forecasts.
Other reports to the FERC, however, comparing estimated vs. actual costs of completed construction, indicate for the third year in a row that companies have consistently estimated new projects' costs higher than needed.
The interstate system Two large tables at the end of this article present a variety of data for U.S. oil and gas pipeline companies: revenue, income, volumes transported, miles operated, and investments in physical plants. These data make possible an analysis of the U.S. regulated interstate pipeline system available nowhere else.
For example, year-to-year, the table on natural gas companies has tracked the historic change in the U.S. gas-transmission industry wrought by less regulation. This OGJ annual report began tracking volumes of gas transported for a fee by major interstate pipelines in the 1988 Pipeline Economics Report (OGJ, Nov. 28, 1988, p. 33) as pipelines moved gradually after 1984 from owning the gas they moved to mostly providing transportation services.
Additionally, this year's table reflects the quickening pace of consolidation taking place as indicated by the several entries for companies that have merged or been bought out.
Reporting changes
Comparing annual U.S. petroleum and natural gas pipeline mileage must be done carefully.
For any calendar year, for example, how many companies are required to file reports with the FERC may vary, as some companies become jurisdictional, others are declared non-jurisdictional, and still others cease to exist through mergers and acquisitions.
Comparisons were complicated further after 1984 when the FERC instituted a two-tier classification system for companies (OGJ, Nov. 25, 1985, p. 55).
Definitions of the categories can be found at the end of the table "Gas pipelines" (p. 69) and in FERC Accounting and Reporting Requirements for Natural Gas Companies, para. 20.011.
Only major gas pipelines are required to file miles operated in a given year. The other companies ("non-major") may indicate miles operated but those numbers are not specifically required.
For several years after 1984, many non-majors did not describe their systems. But recently, filing a description of their systems has become standard, and most have been providing miles operated.
Additionally, reports for 1998 reveal a sharp increase in FERC-defined major gas pipeline companies: from 51 of 113 reporting for 1997 to 60 of 121 for 1998.
The FERC made an additional change to reporting requirements for 1995 for oil pipelines, which includes crude oil and petroleum products.
Exempt from requirements to prepare and file a Form 6 were those pipelines whose operating revenues have been at or less than $350,000 for each of the 3 preceding calendar years.
These companies must now file only an "Annual Cost of Service Based Analysis Schedule" which does not provide miles of line operated but does give total annual cost of service, actual operating revenues, and total throughput in both deliveries and barrel-miles.
More changes came for 1996: Major natural gas pipeline companies were no longer required to report miles of gathering and storage systems separately from transmission.
Thus, total miles operated for gas pipelines consist almost entirely of transmission mileage. To continue to convey a 10-year trend, Table 1 has been adjusted to reflect only transmission mileage operated since 1988.
FERC-regulated natural gas and oil pipeline companies operated more miles in 1998 than in 1997 (Table 1): Final data show an increase of more than 10,000 miles, up more than 5%.
This increase in gas transmission pipeline mileage drove a small increase-but increase, nonetheless-of more than 7,750 miles (>2%) for all transmission-pipeline mileage operated to move natural gas in interstate service. Mileage used in deliveries of petroleum liquids in common-carrier service remained relatively stable, declining by nearly 3,000 miles (-1.7%).
Gas-transmission mileage overall (majors plus non-majors) rose in 1998, compared with 1997, with transmission mileage for majors increasing by more than 10,000 miles (5.7%).
Liquids pipelines' gathering lines fell by nearly 10,000 miles; crude trunk miles operated also, by almost 1,900 miles; and product trunk mileage increased by more than 11,000 miles.
Whether FERC designates a liquids pipeline company an interstate common-carrier pipeline determines whether the company must file a Form 6 FERC annual report for oil-pipeline companies.
Deliveries - In 1998, gas pipelines gathered and moved more than 30 tcf of other companies' gas and sold slightly less than 1 tcf from their own systems. The gas transported for a fee represented an increase of nearly 2.5% over volumes moved in 1997; the gas sold, a nearly 13% drop over volumes sold a year earlier.
In 1997, companies moved slightly less than 30 tcf of others' gas and sold slightly more than 1 tcf. Companies in 1996 had moved nearly 30.7 tcf of other companies' gas and sold more than 1.3 tcf.
Oil pipelines moved only slightly more in 1998 than in 1997 with an overall increase of more than 400 million bbl of crude oil and product delivered.
Product deliveries dropped by more than 400 million bbl (-7%). This followed a decrease in deliveries in 1997 of less than 1% that followed a decrease in 1996 of 4%.
Crude-oil shipments (nearly 60% of total liquids movements) increased sharply by more than 800 million b/d.
Increased waterborne U.S. imports as well as barrels moving through the newly operating Express Pipeline from Alberta to Wyoming accounted for much of this increase.
Trunkline-traffic (1 bbl moving 1 mile = 1 bbl-mile) for U.S. crude-oil and product pipelines decreased sharply over traffic for 1997, following a more gradual drop in 1997.
Rankings
Oil & Gas Journal uses FERC annual-report data to rank the top 10 pipeline companies in three categories (miles operated, trunkline traffic, and operating income) for oil-pipeline companies and three categories (miles operated, gas transported for others, and net income) for natural gas pipeline companies.
For 1998, Equilon Pipeline Co. LLC, newly created from assets of Shell Pipe Line Co., Texaco Pipeline Inc., and Seashell Pipeline Co., jumped to the top spots among oil pipelines for mileage and net income and only ranked for trunkline traffic behind perennial leader Colonial Pipeline Co.
For all natural gas pipeline companies, net income as a portion of gas-plant investment in 1998 rose after falling in 1997 for the second consecutive year. This resumed a 4-year trend that ended with 1995 and represented a rise for 8 of the last 10 years.
The term "gas plant" refers to the physical facilities used to move natural gas: compressors, metering stations, and pipelines.
As a portion of gas-plant investment, net income in 1998 was 4.7%: In 1997, it was 3.8%; 1996, slightly more than 4.0%; 1995, 4.9%.
This indicator of companies' return on investment has risen steadily since 1990. It stood at 8.7% in 1984, the year the FERC began (with Order 436) its restructuring of the interstate gas-pipeline industry that culminated in 1992 with Order 636.
Beginning with 1985, net income as a portion of gas-plant investment fell precipitously through 1987 then began its gradual comeback.
All gas-pipeline companies (majors and non-majors in 1998) reported an industry gas-plant investment totaling more than $63 billion, up from $59.8 billion in 1997. The industry's investment in facilities since 1992 has been steadily growing.
For oil pipeline companies in 1998, net income as a percentage of investment in carrier property fell to 6.8% from 7.3% in 1997, another year of decline. In 1996, this indicator had stood at nearly 8.5%, off from more than 9.5% in 1995. In 1994, the percentage stood at 8.2% compared to 5.5% for 1993, 7.6% in 1992, and 6.6% in 1991.
Actual investment in carrier property fell slightly, to $30.1 billion in 1998 from $30.6 billion in 1997 but still higher than the $28 billion in 1996 and nearly $27.5 billion in 1995.
Carrier property investment this decade has been steadily advancing, dropping only 2.7% in 1994 over 1993.
For many years, Oil & Gas Journal has been tracking carrier-property investment by five crude-oil pipeline and five products-pipeline companies chosen as representative in terms of physical systems and expenditures.
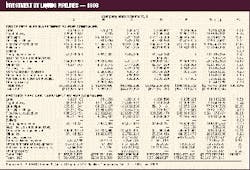
Consistent with the overall trend of increasing property investment, these companies have been increasing their investments steadily in recent years. Table 2 indicates that investment by the five crude-oil pipelines was nearly $3.2 billion, an apparent sharp increase from the $2.3 billion for 1997, $2.1 billion in 1996, $2 billion for 1995, and $1.97 billion for 1994.
But in 1998, a major crude-oil pipeline company that has been included in this list merged with two other large pipeline companies. Comparisons with earlier years are, therefore, inappropriate.
Investment in 1998 by the five product pipeline companies was nearly $3.8 billion, up from slightly from less than $3.7 billion in 1997, and more than $3.6 billion in 1996. In 1995, investment by the companies stood at $3.5 billion; and $3.3 billion in 1994.
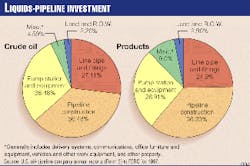
Fig. 2 illustrates the investment split in the crude-oil and products pipeline companies.
Another measure of the profitability of oil and natural gas pipeline companies in recent years is the portion net income represents of operating income (Table 3).
Through 1987, trends for 10 years for liquids-pipeline companies and for natural gas pipeline companies had been heading in opposite directions.
Construction
In the U.S., regulated interstate natural gas pipeline companies must apply for a "certificate of public convenience and necessity" from the FERC to modify facilities (adding pipe or compression or abandoning, selling, or removing it).
These applications, except under special circumstances, must contain estimates of what such modifications will cost.
Annual tracking of the mileage and compression horsepower applied for and of the estimated costs indicates future construction. And Oil & Gas Journal has been doing that since this report began more than 40 years ago.
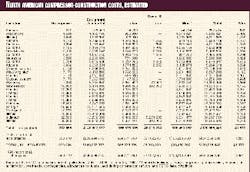
Tables 4 and 5 show companies' estimates during the period July 1, 1998-June 30, 1999, for what it will cost to construct a pipeline or compressor station.
Those tables cover a variety of locations, pipeline sizes, and compressor-horsepower ratings.
Near-term increase - For any period, not all projects that are proposed are approved; not all approved ones are eventually built. Those which proceed can be tracked in OGJ's twice-yearly construction survey.
Filings during the 12 months ending June 30, 1999, provide a look at the immediate future of gas-pipeline construction on the U.S. interstate system:
- 34 land and 2 marine projects (OGJ, Aug. 31, 1998, p. 33)
- 35 land and 4 marine projects (OGJ, Aug. 4, 1997, p. 37)
- 62 land and 2 marine projects (OGJ, Nov. 25, 1996, p. 39)
- 66 land and 3 marine projects (OGJ, Nov. 27, 1995, p. 39).
For the 12 months ending June 30, 1999, the 39 land projects would cost more than $979 million.
Projects' cost projections indicate a great deal about where companies believe unit construction costs ($/mile) are headed. These cost-per-mile figures indeed reveal more about cost trends than aggregate totals.
For proposed U.S. gas-pipeline projects in the 1998-99 period surveyed, the average land cost per mile was slightly more than $1.1 million/mile. For the 1997-98 period, the average land cost per mile was slightly less than $1.2 million.
Components
Variations year-to-year in the four major categories of pipeline construction costs-material, labor, miscellaneous, and right of way (R.O.W.)-can also suggest trends within each group.
Materials can include line pipe, pipe coating, and cathodic protection.
"Miscellaneous" costs generally cover surveying, engineering, supervision, contingencies, telecommunications equipment, allowances for funds used during construction (afudc), administration and overheads, and regulatory filing fees.
R.O.W. costs include obtaining right-of-way and allowing for damages.
For the 39 land projects surveyed for the 1998-99 period covered here, costs-per-mile for the four categories were as follows:
- Material-$275,771/mile
- Labor-$467,696/mile
- Miscellaneous-$282,685/mile
- R.O.W. and damages-$76137/mile.
The average cost per mile for the projects shows few clear-cut trends related to either length or geographic area.
In general, however, the cost per mile within a given diameter indicates that the longer the pipeline, the lower the unit cost for construction. And broadly, lines built nearer populated areas tend to have higher unit (per-mile) costs.
Additionally, road, highway, river, or channel crossings and marshy or rocky terrain each strongly affects pipeline construction costs.
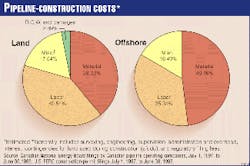
Fig. 3, derived from Table 4, shows the major cost-component splits for land-pipeline construction costs.
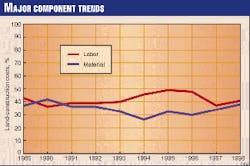
Material and labor for constructing land pipelines make up more than 67% of the cost. Fig. 4 plots a 10-year comparison of land-construction unit costs for the two major components, material and labor.
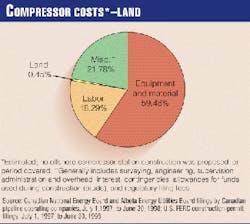
Fig. 5 shows the cost split for land compressor stations based on data in Table 5.
Table 6 lists 10 years of unit ($/mile) land-construction costs for natural gas pipelines with diameters ranging from 8 to 36 in. The table's data consist of estimated costs filed under CP dockets with the FERC, the same data that are shown in Tables 4 and 5.
The average cost per mile for any given diameter, Table 6 shows, may fluctuate from one year to another as projects' costs are affected by geographic location, terrain, population density, or other factors.
Costs-per-mile 1998-99 in Table 6 are somewhat anomalous, as one traditionally tracked category (8 in.) had no projects proposed for it; two others (12 and 20 in.) had only two projects for each.
Year-to-year fluctuations in figures in this table, however, are illustrated in construction figures for a 12-in. pipeline.
What was paid
An operator must file with the FERC what the company has actually spent on an approved and built project. This filing must occur within 6 months after the pipeline's successful hydrostatic testing or the compressor's being placed in service.
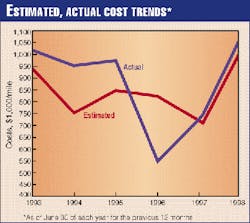
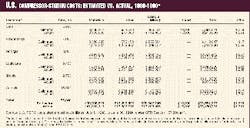
Shown in Fig. 6 are 7 years of estimated-vs.-actual costs on cost-per-mile bases for project totals.
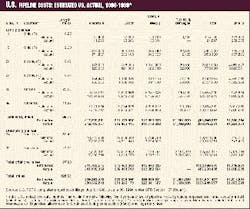
Tables 7 and 8 show such actual costs for pipeline and compressor-station projects reported to the FERC during the 12 months ending June 30, 1999.
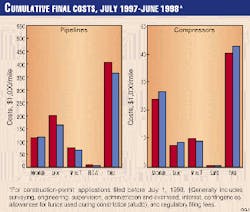
Fig. 7, for the same 12-month period, depicts how total actual costs for each category compared to estimated costs.
Some of these projects may have been proposed and even approved much earlier than the 1-year survey period. Others may have been filed for, approved, and built during the 12-month survey period.
If, in its initial filing, a project was reported in construction "spreads," or mileage segments, that's how projects are broken out in Table 4.
Completed-projects' cost data, however, are usually reported to the FERC for an entire filing, separating only pipeline from compressor-station (or metering site) costs and lumping several diameters together.
Overall, estimated gas-pipeline construction costs exceeded actual ones by more than $17.6 million. If this trend of companies' spending less than they estimate continues, the impact of continued lower revenues and incomes from lower oil and gas demand will be lessened.
Companies spent slightly more than they estimated for materials; but less in each of the other three categories. Costs for labor were significantly less: by more than $12.1 million.
Table 8 shows that actual costs for installing compression exceeded estimates by more than $2.8 million.
Actual costs for labor accounted for much of the difference, exceeding estimates by more than $3.9 million. Material costs exceeded estimates by nearly $2 million.
