Combining GIS And Web Simplifies Access To Corporate Data
The development of new software systems has led industry into a situation in which the amount and flow of information can prevent workers from being focused on executing their primary tasks.
Carrying out a task is typically based on information that is passively received or actively searched for. In making use of received information, it can be difficult to sort out exactly what information is needed. On the other hand, searching for additional relevant information might take a lot of doing.
Streamlining these two processes is crucial for businesses, especially those that rely heavily on information as a means for keeping a competitive edge. The development of worldwide web-based software systems with search functionality has helped, but it does not reduce the amount of information that needs to be shared.
In larger companies, there is also a diversity of information categories, related to a range of specialized tasks in different departments. These tasks require different software systems, which can often only work with their own proprietary data types.
Global business activity also adds a geographic dimension to the information itself. In this case, corporate data are normally distributed on many servers and server types. In addition, access to different data types on different data systems requires different user interfaces.
Oil companies operating worldwide are one group facing this complex scenario. Statoil has piloted a project in which work-relevant information has been made more easily accessible. Through the Visok pilot scheme, an intranet project that simplifies access to Statoil corporate data, we have established the means for navigating through interdisciplinary data in an intuitive and efficient manner.
Visok project
The main aim of Visok was to assist the Statoil exploration and development department in its efforts to improve the availability, quality, and management of work-related information.
Another incentive behind the project was to facilitate improvements in how people worked and cooperated. Finally, we wanted information technology (IT) improvements and organizational changes to be implemented concurrently This article will focus on data availability and the visualization of corporate data.
Several separate objectives were defined for establishing the Visok website. Most importantly, we wanted to give the average user easy access to information stored in databases. Several databases are used regularly, and together they constitute our "corporate data." Data from several sources and systems had to be integrated and presented for access in an intuitive manner, with no or very little training.
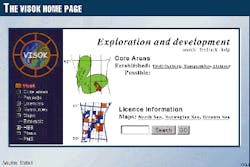
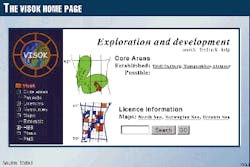
Furthermore, we decided that all hardware and software components should be standard, thus reducing the amount of programming needed. In Statoil, we are currently using Lotus products, so Lotus Domino was chosen as our environment for establishing the website. Fig. 1 shows a simplified version of the home page of the project.
The information categories that we have made available on the website are: core areas, licenses, resources, maps, external links, health, environment and safety, planning, and a performance measurement system.
These subject areas contain information ranging from simple bookmark-type lists to data, which are extracted (pumped) from corporate databases. The "licenses" category is an example of the latter type, where license administration data are made available on our intranet.
This source database, called LISA, is a specialized corporate database. Its user interface is intended for experienced users and is normally not accessed by occasional users. The information in this database is extracted via a data pump and transferred into ordinary web pages on the Domino server.
The Visok website was established using conventional web publishing techniques. The geographic information system (GIS) part required its own software platform, though.
GIS in Visok
Statoil uses an ARC/INFO GIS system to extract geographically related data from its legacy databases for use in a variety of maps.
Maps are extensively used for visualization of licenses, fields, well locations, and pipeline routes, for example. Several in-house projects use ArcView, a PC workstation, downsized version of ARC/INFO for specialized purposes.
When we interviewed users within Statoil, many requested a product that would produce simple maps, especially maps that could easily be transferred into a standard business meeting presentation format.
To address this request, it was decided to implement a web-based GIS mapping system under Visok, making customizable maps available for all Statoil employees. ESRI's Internet Map Server (IMS) was chosen for this purpose. This solution ensured that a standard browser could be used, without the need of any extra software installation or extensive programming.
ESRI's IMS comprises two integral parts: an ArcView 3.0x standalone application and an IMS Extension. The latter extends ArcView's capabilities so that it can handle web-based map requests.
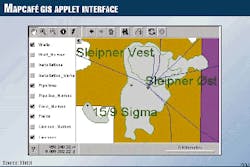
When the user accesses the map server via a standard browser, an applet (website animation program in Java programming language-MapCafé, in this case) is downloaded to the user's browser. The applet is capable of performing simple map operations. Through the applet the user can toggle map layers on or off, zoom, pan, get object attribute information, and perform simple searches. The user can also prepare maps for transfer to desktop publishing tools. Fig. 2 shows the interface for the applet, which runs from within the user's browser.
Current technology limits the functionality of the mapping software when distributed via the web, so the MapCafé applet is currently a very basic GIS system. Nevertheless, one very important feature is its implementation of so-called hotlinks. A hotlink is simply an internet address (URL) that can be attached to each object in the map. The use of the hotlink mechanism was key to the success of the Visok project.
Getting the best of GIS and web
If you display a map on the screen and want to use this for finding some specific information, the combination of GIS and the web is very powerful.
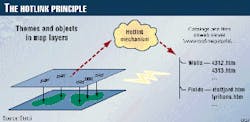
If all objects in all map layers are supplied with an internet link, you can click on any object on the map and go directly to the corresponding internet location. The target location can be anything that is possible to link to a website, a bookmark list, a video clip, any downloadable file, an executable applet-in other words, anything you can imagine. The overall principle of the hotlink is illustrated in Fig. 3.
Implementation of hotlinks is relatively simple. Each map layer attribute table is supplied with an extra URL column containing an internet link. The process of adding an internet link to the maps is easy to program and can be performed at the central server when the maps are generated. Alternatively, it can be supplied manually at the local IMS as part of regular maintenance.
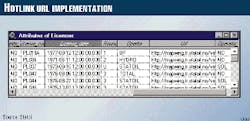
At the moment, the IMS running within the Visok project receives maps with hotlinks generated at the central server. All there is to be done is to make sure that the internet link is valid when the local IMS updates its maps. Fig. 4 shows a small part of the table associated with the license map layer. The hotlinks are located in the URL column to the right of this table.
Linking to information
The actual power of linking from objects in a map to information on the intranet or internet converts the map server into a map information navigator. In the Visok project, we called it the Map Navigator.
With the Map Navigator, it is not mapping capabilities that are the most important function, but its ability to enable the user to get to information in an intuitive manner. The map is now the visualized user interface to selected corporate data. Also, it is now easy to retrieve information from different vendor platforms, as long as the information is published and available via the web.
As an example, in the license information category within Visok, we have established hotlinks between the license map layer and corresponding license home pages. Physically, these two sources of information reside on two separate servers, a Microsoft Internet server and a Lotus Domino server, respectively.
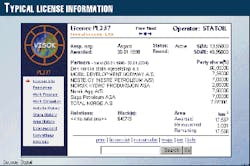
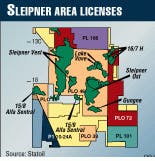
When a user clicks within a license area in the map (Fig. 5), the hotlink mechanism will ensure that the web browser will execute the link and fetch the corresponding license web page. Fig. 6 shows an example of a typical license home page within the Visok project.
In the project data category within Visok, as another example, if a specific project has a geographic relation (for example, a regional evaluation or interpretation project), the boundaries of the information can be mapped to a specific area. The corresponding map layer object can be made and supplied with an internet link. To retrieve project data of some kind, the user simply switches on the map layer of interest and clicks within the project area.
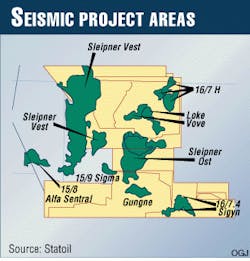
Fig. 7 shows an example in which yellow shading denotes areas where seismic interpretation projects have been carried out. In Visok, we used this approach to enable users to find specific seismic interpretation projects.
In the project data case, it is not important on which media the project data reside. The essential matter is to obtain an address, or reference, from which you can find the information you need.
So using the interactive map combined with the hotlink mechanism can make it easy to find data. The potential time savings can range from hours to days, depending on the age of data or how obscure is the format in which the data is stored.
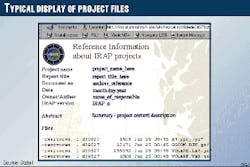
Clicking on a project area in a map, as shown in Fig. 7, directs the user to a web page simply showing which files were used during the project. A generic example of such a page is shown in Fig. 8.
Linking to functionality
The combination of GIS and web provides an added functionality that resembles the way in which geoscientists and many other people in the oil industry are used to working.
By creating specific layers containing various types of information (such as wells, projects, and geological attributes), one can use the "click-on" function of a GIS system to go directly to the web page that contains the information, or additional links to further data.
When the web-enabled systems mature, search facilities and geographical SQL (a programming language) functionality can make it very easy to find relevant information. There is a clear need for added features in the web-based GIS systems, and a rapid development towards added functionality in this area is expected.
All information that is web-enabled and accessible-downloadable can be retrieved via a GIS interface. A natural consequence of this is the ability to use a GIS interface to get access to functionality. The development of Java made this comparatively easy.
Imagine using the hotlink mechanism to point at a location on a map and get some calculations in return. A number of tasks could be performed this way. For example, clicking on a map at a given point could download and invoke an oil spill calculation program, which simulates the spread of oil in case of a blowout from a given location.
Another possible use is to compute strain along an underwater pipeline at certain points. Or pointing to an interpreted area on the map could trigger an application that enables you to start a tape robot to fetch the data of interest.
In all these cases, the map location would be part of the input parameters of such an application-that is, the Java applet hotlinked to the particular map layer. Only the imagination can limit the use of such an access to functionality.
Implications
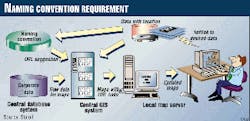
Good planning and a well-defined information structure are important in enabling a company to benefit from utilizing a GIS interface to information and functionality. Fig. 9 illustrates one key requirement, which is a proper naming convention. It is vital in order to automate the use of internet (map) links successfully.
In general, using the web affects how information is collected, prepared, processed, visualized, and filed. Practical use of standard web technology has already changed the way information is handled. It is now common to organize and store intermediate and end-work results in such a way that they are easily accessible by the web. If the interface to that information is well-defined and stable, it is possible to make automated systems that can maintain links to it.
The strategy of using a GIS interface is not the generic answer to all data access challenges, but it might be a supplement to existing methods. In many cases, however, it can be a great advantage to reduce the steps (clicks) needed to get access to information that have a geographic relation. It can be of great help, especially in navigating directly to an information source, before diving into its details.
The Authors
Knut-Olav Fjell holds an MSc in Control Engineering from the Norwegian University of Science and Technology (NTNU). He has worked as systems programmer for different software companies in Trondheim and has been a college lecturer in the Department of Computer Systems at Trondheim College of Engineering. Currently, he is based at the Statoil Research Center, where he works with GIS systems and Coordination Technology.
Ingebret Gausland holds an MSc in Underwater Acoustics from the Norwegian University of Science and Technology. After 1 year as a research assistant at NTNU, he has worked for the Research Council of Norway and for Statoil as a geophysicist, involved with seismic data acquisition and processing, as well as positioning and map use in general. His current function within Statoil is as Special Advisor, occupied with GIS systems and implementation of new IT tools for the exploration department.
