Nelson-Farrar Quarterly Costimating: Changes in the indexes for nonmetallic building materials
Gary Farrar
Contributing Editor
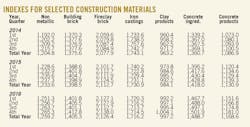
The accompanying table shows how Nelson-Farrar indexes have changed over the 3-year period, 2014-16, for selected basically nonmetallic building materials.
Data are included for the overall nonmetallic group, five nonmetallic materials, and iron castings.
Concrete ingredients and concrete products indexes showed the greatest changes during the period, with concrete ingredients increasing to 1,501.9 in fourth-quarter 2016 from 1,339.2 in first-quarter 2014. Concrete products also rose during the same timeframe to 1,181.0 from 1,073.0.
Building brick and fireclay brick experienced more moderate gains across the 3-year window, although none of the changes in the indexes were drastic. By fourth-quarter 2016, the building brick index stood at 1,412.8 vs. 1,370.3 during first-quarter 2014. Fireclay brick increased in the same period to 2,126.4 from 2,059.6.
Two small index changes occurred in the clay products and iron casting categories. Clay products edged up to 1004.1 in the fourth quarter of 2016 from 960.4 in first-quarter 2014. Iron casting decreased slightly during the same timeframe to 1,714.5 from 1,733.6.
The final category, the overall nonmetallic index, increased to a high of 1,265.3 during fourth-quarter 2016 from a 3-year period low of 1,192.0 in first-quarter 2014.


