Refiners likely to add 7 million b/d in global capacity through 2023
John Auers
Robert Auers
Turner, Mason & Co.
Dallas
Imbalance between proposed new capacity and anticipated demand will deteriorate economics for most refining projects, leading to cancellation or postponement of all but the most compelling and best funded.
Based on its latest detailed analysis of refinery construction activity for 2019-23, Turner, Mason & Co. (TM&C), Dallas, estimates global refiners have announced new refinery additions or expansions to existing operations 2019-23 that would add more than 21 million b/d of capacity, far exceeding projected global petroleum demand growth of less than 6 million b/d during the same period.
TM&C expects 97 capacity expansion projects (about 6.7 million b/d) will actually reach startup during the next 5 years. These additions will put pressure on struggling refineries—primarily in Europe and the Organization for Economic Cooperation and Development (OECD) Asia Pacific regions—and force more than 2 million b/d of existing capacity to close.1
Background
As with any manufacturing activity, the prospects and investment opportunities in the petroleum refining industry are heavily influenced by product demand growth. Unlike other manufacturers—most notably those in evolving high-technology businesses—however, refiners cannot create demand by developing new products (i.e., smart phones, etc.), but rather are dependent on changing demand-growth levels and patterns for gasoline, diesel, petrochemical feedstocks, and other existing products. If refining capacity expansions outpace demand growth, the resulting overcapacity has a negative impact on refinery margins; conversely, when demand grows faster than capacity, utilization-rate increases lead to very healthy margins and incentivize investment to expand capacity. For these reasons, global capacity additions (and plans for new projects) have historically paralleled global product demand patterns, albeit with some lags due to uncertainties between expected and actual demand growth and the length of time it takes to execute projects.
Because of its position at the tail end of the petroleum supply chain, the refining industry depends on developments in the upstream and midstream sectors, which are also important drivers for refinery construction activities. Particularly important are changes in the quality and geographic distribution of crude production, both of which have experienced major shifts in recent years, including the US light tight oil (LTO) revolution, the collapse in Venezuelan production, pipeline takeaway constraints out of Canada and West Texas, and a variety of other developments. Perhaps most important in relation to refiners and capital investment in new facilities is a lightening of the global crude slate, which is a substantial change from previous expectations.
Beyond these primary supply and demand drivers, other factors which have and will continue to influence refinery construction activity and investment include regulatory policies, technology improvements and breakthroughs, and geopolitics. These forces will work together to affect where, what type, and how many projects will be developed and ultimately constructed.
A look back
Over the past several decades, shifting product demand patterns have led to a corresponding shift in the global refining industry. As increasing demand growth in emerging economies combined with slowing growth in developed economies of the Organization for Economic Cooperation and Development (OECD) countries, refining capacity additions have more and more been concentrated in those developing areas. The global recession of 2008 accelerated this trend, as it led to major rationalization in much of the OECD footprint, especially Europe and Japan. Between 2008-13, refining capacity in those regions was reduced by over 2 million b/d (three fourths of this in Europe), as uncompetitive refineries were shuttered in the face of declining regional demand. The US was a major exception to this trend, as the LTO revolution, combined with other competitive benefits, incentivized domestic capacity additions. Difficulties in the Latin American refining environment—where both capacity and utilization declined even while demand was increasing—also benefitted US refiners, as they were able to rapidly grow product exports to make up for stagnating domestic demand.
The collapse in crude oil prices in 2014 due to the LTO revolution resulted in at least a temporary shift in product demand patterns, as low prices boosted demand in most OECD countries. This led to a “European Spring,” including a corresponding and substantial slowing of capacity rationalization on the continent. US demand has also been strong and capacity growth accelerated, but Japan has been an outlier among the developed nations, with demand declines continuing, along with shutdowns of noncompetitive refining capacity.
While the low-price environment was also positive for overall global demand growth, refinery capacity growth has taken a breather in much of the developing world over the past few years, especially in China and India, which previously had led the charge in growth. This development overwhelmed the improved environment in Europe and expansions in the US, limiting net-refining capacity additions over the past 5 years (2013-18) to about 3.7 million b/d, well below the 2008-13 total of 5.1 million b/d.
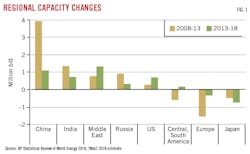
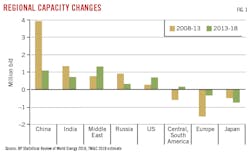
Fig. 1 shows refining capacity changes over the past decade for selected countries.
Due to continued strong economic and product-demand growth, China has experienced the most refinery construction activity by far, adding a total of more than 5 million b/d since 2008, which represents more than 55% of the global net total. Capacity additions in the country have slowed noticeably over the past 5 years, however, as only about 1.1 million b/d has been added since 2013 compared to 3.9 million b/d during the previous 5 years (Fig. 1). India was a clear but distant second, adding about 2 million b/d of capacity. As with China, though, expansions have slowed considerably over the past 5 years (from more than 1.3 million b/d in 2008-13 to only about 700,000 b/d during the last 5 years). A similar dynamic has occurred in third-place Russia, where 1.2 million b/d of net refinery capacity expansion has occurred over the last decade, only about one-fourth of which was during the past 5 years. The US, which came in fourth in capacity additions over the past 10 years, experienced the opposite trend, with more than 70% of the total capacity (682,000 b/d of 935,000 b/d) coming online since 2013. The Middle East (primarily Saudi Arabia, UAE, Iran, Qatar, and Iraq), also experienced capacity increases during the second half of the decade (1.3 million b/d of the total 2+ million b/d coming online since 2013). Excluding the US, refining capacity in OECD countries declined by 2.7 million b/d during the past decade, with the declines strongest in Japan (1.3 million b/d), France (700,000+ b/d) UK (600,000 b/d) and Italy (500,000 b/d), while South Korea joined the US as an outlier, growing capacity by more than 500,000 b/d. As previously noted, low oil prices and the resulting improvement in Europe’s demand has slowed rationalization on that continent during the past 5 years, with less than 400,000 b/d of the decade’s total 1.9 million b/d overall decline occurring since 2013.
Product demand growth has been the largest factor driving the location of new refining investments, with crude supply developments also a factor (particularly in the US). Regulatory issues have had only a minor influence on crude capacity additions but were instrumental in requiring investment in downstream processing modifications and improvements, particularly in response to ever-tightening specifications on the sulfur level in transportation fuels (gasoline and diesel). Changing demand patterns also were a major factor in downstream processing investment, as refiners strove to respond to changes in relative demand for diesel, gasoline, petrochemicals, heavy fuel oil, and other products. Technology developments played an important role in what types of units were built and how new refineries were configured.
2019-23 outlook methodology
TM&C has monitored global refining projects for more than 12 years. Data for each project is gathered from publicly available sources, including press reports and corporate announcements (from owners and vendors), corporate financial filings, and other reporting entities. TM&C analyzes the data and makes adjustments and independent assessments of project completion probability and timing. A key aspect of our independent analysis includes estimates for the changes in crude demand by quality or type (i.e., heavy sour, light sweet, medium, etc.) and product yield proportions (gasoline, distillate, resid, etc.), as well as the type and capacity of new or modified downstream units included in each of the projects.
Outlook through 2023
As is always the case, announced global refining additions greatly exceed the level of capacity needed to meet product demand growth. TM&C keeps an updated list of all refinery project announcements which pass some minimum threshold of credibility. In our forward-looking project analysis, we generally limit the future timeline to 5 years, which currently envisions a planned total of 21.2 million b/d of crude processing capacity additions through 2023 (announced list). Estimated capital requirements for these 211 projects exceed $730 billion. Over the same period, however, global product demand is anticipated to rise by only about 6 million b/d. More than 2 million b/d of this demand growth will be met by nonpetroleum sources, including increased NGL output and rising volumes of ethanol, biodiesel, and other alternate fuels. This imbalance indicates that a large majority of these refining projects will not be completed, at least within the announced timeframe.
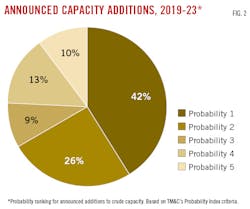
TM&C evaluates numerous criteria to determine which projects are likely to come to fruition using a Probability Index based on a scale of 1-5, where 1 represents a very low likelihood of completion (0-20%) and 5 represents a project already well under construction and-or highly likely in TM&C’s judgment to be completed (80-100%). Numerous criteria are used in this evaluation (in addition to actual construction progress), including economic rationale, financial standing of the project, ownership, the owner’s ability to fund or finance the project, regional crude and product balances, and past performance of participants.
We make the judgment in our analysis that only projects with a Probability Index of 3 or higher will be built within the 5-year timeframe of our outlook (probable list). This represents less than 30% of the announced capacity additions.
Fig. 2 summarizes TM&C’s categorization of announced worldwide projects based on the Probability Index criteria.
TM&C’s probable refinery construction outlook includes 97 (of 211 total announced) global projects, which would add nearly 6.7 million b/d of crude processing capacity. Of these projects, 18 are new, grassroots refineries. Assuming an average utilization rate for this new capacity of 88%, 2.8 million b/d of existing refining capacity will need to be closed (based on an assumed lower 75% utilization rate) in the next 5 years to maintain global utilization rates at current levels. This closure rate would be largely greater than that of the last 5 years, but additional capacity rationalization could be slower given that considerable noncompetitive capacity has already been shuttered and global refinery utilizations are currently near record highs. Consistent with recent history, TM&C believes that the additional capacity closures will come primarily in Europe, OECD Asia, and the Former Soviet Union (FSU). If more closures occur, then global utilization rates would need to be higher, resulting in a more favorable refining environment; the reverse would be true if closures were lower. Required capital expenditures for projects included in the probable list total about $290 billion through 2023, averaging just under $60 billion/year.
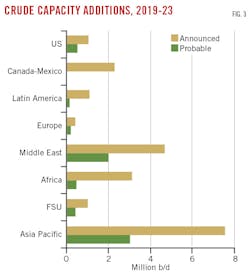
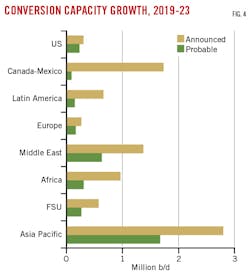
Locations of probable capacity additions generally mirror TM&C’s forecast for regional demand growth (Fig. 3). With 34% of the world’s population, the Asia Pacific includes 36% of announced crude capacity additions and 45% of likely crude capacity additions, lower than our estimate that about 64% of net global product demand growth will take place in the region through 2023. The Middle East has the second largest regional growth with 22% of the announced crude projects and 29% of the probable crude projects. While growing internal demand is spurring some of these projects, many are also targeting export markets, particularly in the Asia Pacific. Anticipated increases in conversion unit capacities are similarly distributed (Fig. 4). Conversion capacity increases are greatest in the Asia Pacific and the Middle East.
The seven largest refinery projects we believe will be completed in the next 5 years share several common elements that increase the likelihood of their completion and are the main reasons they are included in our probable refinery construction outlook (Table 1). The first two, located in Saudi Arabia and Kuwait, will be supplied by advantaged price crude oil, benefit from strong local and regional demand growth, and are supported by large, well-funded, and economically stable sponsors. The next five, all located in the Asia Pacific, are in the fastest growing petroleum demand region and are supported by large, well-funded, and economically stable sponsors
Regional drivers, trends
Differences in regional refining operating and construction expertise or resources can also have major impacts on refining construction decisions and success. Past operating and construction cost performance and experience can either stimulate or inhibit new construction.
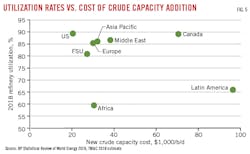
Fig. 5 shows the cost of probable crude capacity additions through 2023 vs. 2018 global refining utilization rates.
Proposed projects in regions with historically high construction costs or low operating rates will have a lower probability of construction success than those located in regions where performance has been superior. Two regions in particular—Latin America and Africa—have experienced both high refinery construction costs and low capacity utilizations. Not surprisingly, projected refining capacity increases in these regions are below anticipated product demand growth over the next 5 years. Markets in these regions have increasingly been supplied by exports from more competitive refining centers, especially the US and the Middle East, with even challenged European refiners benefiting to some degree.
One of the most important events driving refining construction activity and rationalization in the coming years will be next year’s transition to low-sulfur bunker fuel. Mandated by the International Maritime Organization (IMO), the introduction of 0.5% sulfur bunker fuel will have a major impact—both good and bad—on the global refining industry. Refiners have, so far, made very limited major project announcements specifically related to meeting the IMO 2020 regulation due to high capital costs, long project lead times, and resulting worries about stranded capital, with very few new resid hydrotreaters and relatively modest coking capacity additions (considering the total crude capacity additions) planned over the next several years.
On the marine side of the IMO compliance equation, the global maritime industry has also been slow in making investments in scrubbers, and although they have recently started accelerating their plans, vessel conversions will still be very limited by January 2020. Our current estimates show that by January 2020, less than 10% of total bunker demand will be high-sulfur fuel oil (HSFO) consumed by ships outfitted with scrubbers. While TM&C estimates this figure rising to about 30% by 2025, this estimate remains subject to large uncertainty based on market developments over the next couple of years.
Because of the slow responses of the refining and maritime industries, we expect initial compliance will be achieved by blending large volumes of low-sulfur distillate and vacuum gas oil into the bunker pool, backing out slightly lower volumes (based on relative BTU values) of noncompliant HSFO. The distillate blending will cause a spike in global distillate demand, resulting in rising distillate prices. Because the nonbunker fuel oil market will be unable to absorb the volume of displaced fuel oil from the bunker pool, prices for high-sulfur resid will be pressured lower.
These shifts in product prices will correspondingly impact pricing differentials for various crude grades relative to benchmark West Texas Intermediate and Brent. Fuel oil refiners will move to increase light crude processing rates to reduce fuel oil yields, driving up light crude prices. Surplus fuel oil could be blended with light crude grades to produce synthetic heavy grades, which will lower heavy crude prices.
Refiners are aware of the expected IMO price impacts, and although they remain cautious regarding major projects, they aren’t sitting on their hands waiting for IMO to happen. On the contrary, many are making smaller, unannounced investments and adjustments to their operations. These changes won’t appear in TM&C’s project list but will rather resemble the types of unreported projects which have led to capacity creep over the years and are often implemented during routine maintenance turnarounds. Many of these projects will be targeted to squeeze some incremental capacity out of existing cokers and hydrocrackers, or otherwise take advantage of anticipated margin impacts of IMO. It’s also possible these post-2020 IMO changes in the market for both crudes and products will provide the necessary pricing stimuli for and play an important role (along with other changes in product demand and crude supply) in the next round of refining investments, with project completions beyond 2023.
Global product balances
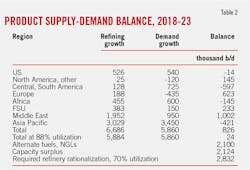
While probable global refining capacity additions are projected to total 6.7 million b/d through 2023, TM&C expects actual processing rates for these projects to rise by only about 5.9 million b/d (assuming 88% utilization rates). This increase is about equal to the projected increase in global product demand noted earlier, but when accounting for the estimated production growth of NGLs and biofuels, it results in a surplus of more than 2 million b/d. To balance refined product supply with demand, an additional worldwide capacity rationalization of as much as 2.8 million b/d (assuming 75% utilization rates for these less competitive refineries) will be necessary (Table 2).
Looking at supply-demand dynamics on a regional basis (excluding impacts of nonpetroleum alternatives and refinery closures), refining growth will not keep pace with demand growth in Central and South America, Africa, and the Asia Pacific regions. Europe, the Former Soviet Union (FSU), the Middle East, and the rest of North America show increasing product surpluses, as does the US if the anticipated strong growth in NGLs—together with some additional growth in alternatives—is considered. These developments hold important implications for future trade flows and regional refining economics, as crude-capacity changes alone do not tell the whole story.
The types of crude (heavy, medium, light) a refinery is configured to process, along with the types of products it will produce (gasoline, diesel, resid, other) compared to the relative production growth of different crude grades and demand growth for various products will influence both differential pricing of those crudes relative to their benchmarks and product margins. The growing mismatch between crude production growth (which is getting lighter as US LTO production increases and Latin American heavy production decreases) and the types of new refinery capacity coming online and targeted towards heavier grades undoubtedly will be very impactful. Further analyses of these dynamics are beyond the scope of this article but are covered elsewhere.1-2
Winners, losers
TM&C estimates most of the 2 million+ b/d of capacity rationalization required to maintain supply-demand parity during the next 5 years will continue to occur in Europe and OECD Asia Pacific.
The move to low-sulfur bunker fuel in 2020 will pressure fuel oil-producing refineries, but the impact will be delayed and reduced in government-controlled and subsidized operations in Latin America, Africa, the Middle East, and much of the Asia Pacific, although—even in these countries—less-competitive refineries will be considered for closure as new capacity comes online. Market-based refineries in Europe, Japan, South Korea, Taiwan, the Philippines, Australia, and Oceania will continue to bear the brunt of immediate pressure.
Deep conversion refineries will benefit from the new IMO regulations via higher distillate prices as well as deeper discounts for heavy crude feedstock relative to the WTI and Brent pricing benchmarks. This will include many refineries in North America, particularly in the US Gulf Coast, West Coast, and Midcontinent regions. Light crude resid-cracking will also be advantaged, though to a lesser degree. TM&C expects only a handful of US refineries will experience any substantive negative impacts because of the new IMO rules.
From a trade-flow standpoint, we expect continued demand growth for product imports into Latin America and Africa, as well as into OECD Asia Pacific given anticipated capacity closures in that region.
The competitive advantages US refiners enjoy will allow them to continue increasing product exports to take advantage of regional shortfalls. While these exports will remain bound for destinations primarily in Latin America, ample opportunities exist to increase export volumes to product-deficient markets in West Africa as well as select markets in the Asia Pacific. Middle East refiners also will have opportunities to grow exports to parts of Africa and the Asia Pacific.
Growing product surpluses from producers in feedstock-advantaged regions of the US, Middle East, and FSU, however, will continue weighing on struggling European refineries, providing further impetus to rationalize capacity of weaker regional operations.
Not all projects included on our probable list of project completions will be completed on schedule or even at all. At the same time, it is likely that some announced projects below our cut line (Probability Index Categories 1-2) will advance and be completed within the next 5 years. Other projects which have yet to make our announced list may also come to fruition in that time frame.
While these developments, by and large, will cancel each other out, if a particularly large project from our probable list runs into roadblocks and is delayed or cancelled—or if a project not currently on the probable list does reach startup—global balances and trade flows could be substantively impacted. Projects falling into this last group and that remain on our watch list for a possible upgrade in the future include:
• Dangote Industries Ltd. subsidiary Dangote Oil Refining Co.’s 650,000-b/d grassroots integrated refining complex now under construction in southwestern Nigeria’s Lekki Free Trade Zone, near the capital of Lagos.
• Sonangol EP and GPM International Global Services’ 400,000-b/d Prince de Kinkakala refinery planned for Ambriz, Bengo Province, Angola.
• China Petrochemical Corp. (Sinopec) and Petroleum Oil & Gas Corp. of South Africa’s (PetroSA) proposed 350,000-b/d refinery at Coega in Port Elizabeth, South Africa.
• Other substantial projects still in early stages of development planned for China, India, Indonesia, other parts of South and East Asia, Latin America, and the Middle East.
Of particular note, we have included on our probable list the first 400,000-b/d phase of Ratnagiri Refinery & Petrochemicals Ltd.’s—a consortium of public-sector refining firms Indian Oil Corp. Ltd., Bharat Petroleum Corp. Ltd., and Hindustan Petroleum Corp. Ltd. alongside overseas strategic partners Saudi Aramco and Abu Dhabi National Oil Co.—proposed 1.2 million b/d grassroots integrated refining and petrochemical complex at Babulwadi, Taluka Rajapur, in Ratnagiri District, Maharashtra, on India’s west coast. Grading out at a 3 (40-60% chance of completion by 2023), the project could easily either be delayed or accelerated. Other projects (totaling almost 2 million b/d of new capacity) included in our probable list currently only grading out at a 3 could also be delayed, accelerated, or even cancelled before reaching scheduled startup.
References
1. “The 2019 Worldwide Refinery Construction Outlook,” Turner, Mason & Co., Dallas, February 2019.
2. “The 2019 Crude and Refined Products Outlook,” Turner, Mason & Co., Dallas, February 2019.
The authors
John R. Auers ([email protected]) is the executive vice-president with Turner, Mason & Co., Dallas He is the team leader of the Crude and Refined Products Outlook, Worldwide Refinery Construction Outlook, World Crude Oil Outlook, and North American Crude Oil Outlook. He also leads assignments in the areas of refining economics and planning, LP modeling, downstream asset valuation, crude oil valuation, and capital investment and strategic planning. Auers joined the firm in 1987 after 7 years with Exxon Corp., with which he held various positions at its Baytown, Tex., refinery. He holds a BS (1980) in chemical engineering from the University of Nebraska and an MBA (1984) from the University of Houston-Clear Lake. Auers is a licensed professional engineer in Texas and Nebraska and is a member of TSPE and AIChE.
Robert Auers ([email protected]) is a senior consultant with Turner, Mason & Co., Dallas, where he is a key member of TM&C’s Outlook team and serves as coauthor and primary analyst for its Worldwide Refinery Construction Outlook. Before joining TM&C, he held several positions at Western Refining Inc.’s (now Marathon Petroleum Corp.) El Paso, Tex., refinery. Auers holds a BS (2013) in chemical engineering from the University of Texas at Austin. He has passed all three levels of the chartered financial analyst (CFA) program and is on schedule to be awarded chartered status upon completing the required work experience.
