Gas-plant tests reveal cost-effective inspection, maintenance practices
Tests at selected gas processing plants indicate that the greatest opportunities for cost-effective reduction of natural gas losses are from the control of leaking equipment components and leakage of process gas into vent and flare systems.
Actual opportunities may vary between sites, and not all gas plants will offer sufficient opportunities to justify the associated identification and control costs.
Nonetheless, available data show that significant opportunities exist at some facilities and a systematic approach to finding these opportunities may result in cost savings for industry.
While any economical-to-repair leaking components detected by such efforts should be repaired, average leak rates based on combined data from the four test sites suggest that the most cost effective approach would be to focus generally on block and control valves, pressure relief valves, regulators, flange connections compressor seals, and compressor valve stems and valve caps.
Normally, flange connections are not a key leak contributor at gas facilities. Their relative importance here is attributed to their use of molecular-sieve dehydrators and the corresponding high leak potential in these applications (due to the thermal cycling of the mole-sieve beds).
Plants selected
The Gas Technology Institute (GTI; formerly Gas Research Institute) in conjunction with the US Environmental Protection Agency's Natural Gas STAR Program and industry participants conducted an intensive fugitive-component screening and measurement program during fourth quarter 2000.
The program evaluated four natural gas processing facilities of various ages, types, and throughputs with a strong emphasis on fugitive methane components in services with cyclical heat and vibration.
The facilities included sweet and sour gas processing and a variety of processes including compression; separation; stabilization; deep cryogenic recovery and rejection; mole sieve, triethylene and diethylene glycol (TEG and DEG) dehydration; amine, sulfur treatment; and flare systems for determining leak rate potential.
In addition, limited testing of fuel-fired sources determined opportunities to improve fuel efficiencies.
Directed inspection and maintenance at gas processing plants are among several best-management practices recommended in the STAR Program, a voluntary partnership that aims to help oil and gas companies reduce methane emissions.
It recently launched a new sub-program for gas processors. Results suggest that processing plant operators can reduce gas losses significantly while enhancing profits.
The primary objective of the current field study was to demonstrate the cost-effectiveness of conducting a comprehensive leak detection and repair program at domestic gas production and processing facilities using GTI's Hi-Flow Sampler technology.
Field measurements included an assessment of emissions from continuous vents, combustion equipment, and flare systems, and diagnostic checks of natural gas-fueled equipment. Such efforts provide an opportunity to achieve sensible and verifiable reductions in greenhouse gas emissions, as well as a financial opportunity for industry.
The results of the measurement program include an inventory of the determined emissions, emission factors for fugitive equipment leaks, and a comparison of these values with corresponding factors published by EPA1 and EPA and GTI2 for the natural gas industry, and an overview of the identified control opportunities.
Also highlighted in this discussion are the opportunities identified during this program to improve fuel efficiencies, reduce leakage into flare systems, and minimize process venting and storage losses.
Method 21
Most leak detection and repair programs in the natural gas industry rely on EPA's Method 21. This measures the concentration of methane in air from a leaking component and then uses a correlation equation to estimate the leak rate.
In a conventional leak detection and repair program for the control of fugitive emissions, Method 21 screens the facility for leaks at a prescribed frequency (quarterly or annually, for example). All components that screen at greater than a given threshold (typically 10,000 ppm) are to be repaired.
The problem is that concentration is a very poor surrogate for the actual leak rate and many more leaks are unnecessarily repaired to reduce emissions significantly.
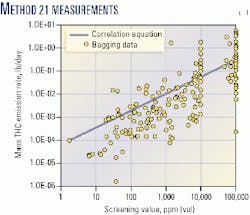
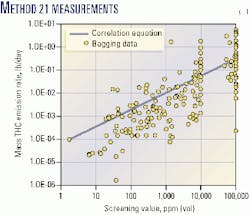
Fig. 1 shows concentration values measured by Method 21 plotted against the leak rate. The scatter in the data (Fig. 1) is nearly plus or minus two orders of magnitude.
Data collected by GTI show that only 10% of the fugitive components that screen at greater than 10,000 ppm at natural gas facilities are cost-effective to repair. On the other hand, 20% of the fittings that screened less than 10,000 ppm are cost-effective to repair and would not be repaired with standard Method 21 criteria.
By repairing all components that screen at greater than 10,000 ppm, operators waste resources by non cost-effectively repairing components with extremely small leaks, while not fixing many components that screen less than 10,000 ppm even though they have a significant leak rate.
Also, the conventional approach does not provide an accurate measure of either the baseline emissions from the facility or the amount of emissions reduced (error is ±300%). Because the reduction in emissions cannot be determined, the benefits of implementing a leak detection and repair program cannot be evaluated.
Additionally, the correlation equations only screen concentrations of 10,000-100,000 ppm; any leak at greater than these screening concentrations has the same estimated leak rate (known as a "pegged source" emission factor). Many leaks are greater than these concentrations but not cost effective to repair. This is especially true in the natural gas industry.
GTI has significantly reduced the cost of applying leak detection and repair programs at natural gas facilities through the use of the Hi-Flow Sampler and cost-efficient leak detection techniques and methodologies.
GTI data have shown that when this procedure is implemented at natural gas compressor stations, emissions can be reduced by 80-90% with a payback period of 6-12 months.
With an estimate of the repair cost and the measured leak rate, leaks can be ranked by payback period. Since the data show that 10% of the leaks are responsible for 80-90% of the emissions from a facility, significant reductions can be achieved by repairing a relatively small number of leaks.
Site selection; methodology
The four test facilities were chosen to provide a representative cross section of older gas plants with significant on-site compression. These types of facilities were expected to offer the greatest opportunities for cost-effective reduction of natural gas losses.
Table 1 shows that three sweet and one sour-gas processing plants were selected. These plants ranged from 25 to 50 years old, and all had deep-cut liquids extraction facilities, compression facilities, and mole-sieve dehydration units.
The main elements of each site survey included the following, as applicable:
- Screening of equipment components to detect leaks.
- Measurement of emission rates from identified leaking equipment components (i.e., leakers).
- Measurement of emissions from continuous vents and residual flows from emergency vents during passive periods.
- Developing counts of the surveyed equipment components.
- Measurement of residual flare-gas rates.
- Performance testing of natural gas-fueled combustion equipment.
- Sampling of process and waste streams.
- Development of the emissions inventory.
- Determination of site-specific average emission factors for fugitive equipment leaks.
- Cost-benefit analysis of the identified control opportunities.
Component screening
Equipment components on all process, fuel, and waste gas (flare header) systems were screened for leaks.
The types of components surveyed included flanged and threaded connections (connectors), valves, pressure-relief devices, open-ended lines, blowdown vents (during passive periods), instrument fittings, regulator and actuator diaphragms, compressor seals, compressor crankcase vents, engine crankcase vents, sewer drains, sump and drain tank vents.
Components in light-liquid service generally were not screened because of their typically low percentage contribution to total emissions from fugitive equipment leaks at natural gas facilities and their low average leak rates.
Leak detection (or screening) was done with bubble tests with soap solution, portable hydrocarbon gas detectors (Bascom-Turner Gas Sentry CGI-201 and CGI-211 and a GMI Gas Surveyor3), and an ultrasonic leak detector (SDT International, SDT-120).
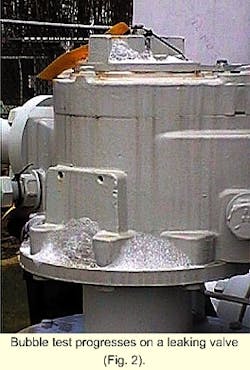
Bubble tests (Fig. 2) were performed on the majority of components (including pipe threads, tubing connections, and valves) because it is generally the fastest screening technique.
Components that could not be screened with bubble tests included any in high-temperature service, certain flanged connections, and open-ended lines. These were screened with the gas detectors. Ultrasonic detectors are effective for leak detection in areas with low background noise levels in the ultrasonic range.
In all cases, a screening value of 10,000 ppm or greater was used as the leak definition. If a component was determined to be emitting by one of the alternative techniques (bubble tests or the ultrasonic leak detector), it was then screened with the hydrocarbon vapor analyzer to determine if the component would be classified as a leaker.
All identified leaking components were tagged, the specific source of leak and date were noted on each tag, and measurements were performed to quantify the actual leak rate using the HiFlow Sampler.
The basic information recorded for each leaking component included component type, model or style of component, service, size, process unit, process stream, process pressure, and process temperature.
Leak-rate measurements
The sampler was the primary method used to measure emission rates from leaking equipment components. It was not used in any components leaking at rates greater than the upper flow rate limit of the unit (more than about 8.25 cfm [14 cu m/hr] for the current HiFlow design) nor in most open-ended lines and vents.
Direct measurement techniques, as appropriate, were used in these cases.
The sampler was developed by GTI as an economic means of measuring the emission rate from individual leaking equipment components with sufficient accuracy to allow an objective cost-benefit analysis of each repair opportunity.
Many components defined as leakers (a screening value of 10,000 ppm or greater) are uneconomic to repair and do not contribute appreciably to total site-wide fugitive emissions. To bag all leakers in order to differentiate between economic-to-repair and uneconomic-to-repair components is cost prohibitive and, therefore, not done. (Typically, 6 to 15/hr leak-rate measurements can be performed with the sampler compared to only 2/hr with bagging techniques.)
Furthermore, compiling Method 21 screening data for these components and then applying leak-rate correlations or stratified emission factors to the results do not provide sufficient accuracy for this purpose.3
The uncertainties in the correlation predictions on an individual component basis are plus or minus two orders of magnitude and the use of stratified emission factors is even less reliable.
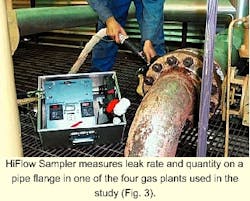
In comparison, the results of HiFlow and bagging measurements contain uncertainties of only 10-15%. Accordingly, the sampler (Fig. 3) provides a practicable means of making objective repair decisions.
Its operating principle is simple-a variable-rate induced-flow sampling system captures the emissions from a leaking component. An assortment of specially designed attachments for use as needed ensure total emissions capture or help prevent interference from other nearby sources.
A dual-element hydrocarbon detector (catalytic-oxidation, thermal-conductivity) inserted directly in the main sample line within the sampler measures hydrocarbon concentrations in the captured air stream ranging of 0.01-100%.
A background sample-collection line and hydrocarbon detector allow the sample readings to be corrected for ambient gas concentrations, which is particularly important in buildings and confined areas.
A thermal anemometer, also inserted directly into the main sample line, monitors the mass flow rate of the sampled air-hydrocarbon gas mixture. The HiFlow Sampler is intrinsically safe and equipped with a grounding wire to dissipate any static charge that may accumulate as air passes through the sample collection line and instrument.
The battery-operated fan in the sampler can generate a maximum sampling velocity of approximately 366 l./min (1,200 fpm).
A backpressure valve mounted on the fan outlet manually adjusts the sampling rate. For large leaks, the backpressure valve is left open; while for small leaks, the airflow rate is reduced so that the hydrocarbon concentration is within the sensing range of the hydrocarbon detector.
The sample and background hydrocarbon detectors in the sampler were calibrated to 100% methane and 2.5% methane-in-air to cover both ranges of the dual-element detector system. Zeroing of the detectors was with ambient air upwind of the facilities. The calibrations were performed before use of the sampler at each site and then periodically thereafter to ensure that no significant drift occurred.
Measuring venting rates
The emission rates from open-ended lines and vents were measured with a precision rotary meter, diaphragm flow meter, or rotameter, depending on the flow rate. Measurements were done if total-flow capture was safe and practicable to achieve and the resulting backpressure on the vent system could be tolerated.
Otherwise, flows were determined by measurement of the velocity profile across the vent line and the flow area at that point.
Flow velocities were measured with a pitot tube, hot-wire anemometer, or thermal dispersion anemometer. The traverse points were selected in general accordance with EPA Methods 1 and 1A.
A distinction was made between continuous and intermittent vent systems.
Emissions from intermittent vents during inactive periods were defined as leakage. Emissions from continuous vent systems and intermittent vent systems during active periods were defined as venting emissions.
Screening with a hydrocarbon sensor detected leaks from vents and open-ended lines.
Residual flaring rates
Flows in flare lines were determined with one of two methods, presented in order of decreasing reliability and preference:
- Measurement of the velocity profile and flow area in the flare line. This is the same approach as described for measuring flows in vent lines. It requires a safe-to-access port on the stack, the common line to the flare, or on each branch line connected to the flare system.
- Back-calculation based on pressure drops. The pressure drop between the flare tip and a suitable upstream point on the flare line is measured and then the amount of flow required to produce an equivalent pressure drop is determined by back-calculation.
In each case, a portable combustible-gas detector or a detailed laboratory analysis of the flare gas (where available) determined the hydrocarbon concentration of the stream.
Determination of flows in continuous flare systems allows a review of the economics associated with recovering product from this waste gas. The determination of residual flows for intermittent flare systems provides an indication of the combined purge-gas flow rate and leakage rates into the flare system.
To distinguish between purge gas flows and leakage, the minimum required purge gas rate was calculated with the procedure presented by Stone,6 and subtracted from the total residual flare rate. The difference was the leakage, or the potentially avoidable gas loss.
Performance testing
Each natural gas-fueled engine and process heater or boiler was tested to identify avoidable inefficiencies resulting in excessive fuel consumption and emissions.
The focus was on identifying situations in which equipment either needed tuning or repairs or was mismatched for the current process demands resulting in operation low on the unit's performance curve. Identification of opportunities to recoup waste heat from the units or to reduce energy requirements through process modifications was beyond the scope of the project.
The testing done on each unit involved analyzing the flue gas, measuring the flue gas temperature, obtaining an analysis of the fuel gas composition, and where possible, measuring the flow rate of one or more of the following: fuel gas, combustion air, flue gas.
Additionally, the make and model of each unit and ambient conditions at each site were recorded.
Typically, insufficient process data were available to allow a reliable estimate of the total amount of useful process work done by each unit or to determine overall unit performance. Consequently, a simplified approach was taken in which the following parameters were evaluated and their departures from proper operating conditions used to quantify opportunities for improvement:
- Residual heat content of the discharged flue gas (stack losses).
- Excess air setting.
- Concentration of CO and unburned hydrocarbons in the flue gas.
Additionally, the crankcase vents on all reciprocating engines were checked for significant blow-by (leakage past the piston rings into the crankcase) resulting in inefficient operation and increased atmospheric emissions.
The true loss in performance resulting from blow-by is difficult to assess without considerable effort. Measurements to quantify the amount of combustible gases emitted as blow-by from the crankcase vent served as a simple approximation. These results are presented as fugitive equipment leaks.
On integral compressor units (compressor units in which the engine and compressor share a common crankshaft and crankcase), blow-by more often results from leakage of process gas from the compressor into the crankcase.
The flue gas analyses used an Enerac 2000E Portable Combustion Analyzer equipped with detectors for O2, CO, CO2, NOx, combustibles, and thermocouples for measuring ambient and stack-gas temperatures. The flue gas was sampled either through a convenient sampling port on the exhaust stack or at the top of the stack.
Emission factors
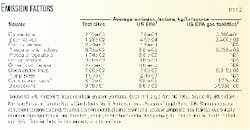
Average emission factors were determined for each type of equipment component in natural gas service at the surveyed sites. Table 2 compares the results to corresponding published factors.1 2
The average emission factors are simply the total emissions from all tested components divided by the total number of components of that type. Quantification of emissions from non-leaking components (components with screening values between 0 and 10,000 ppm) was not attempted.
Instead, emissions from these components were assumed to be represented by the average no-leak emission rates presented in the Protocol for Equipment Leak Emission Estimates.1
The developed emission factors derived are significantly greater than those published for oil and gas production operations in the Protocol but are comparable to the average emissions factors for gas facilities.4
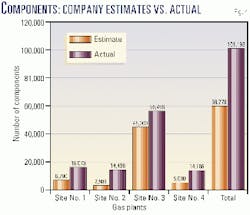
Before start of the fieldwork, each host facility provided estimated counts of the total number of components in hydrocarbon service at its site. During the fieldwork, actual component counts were developed at each site.
It is noteworthy that the plant estimates were generally much lower than the actual counts (Fig. 4.) On average the component counts were about 60% of the actual counts.
One explanation is that the component counts supplied by facilities reflected total numbers of components in hydrocarbon gas and liquid service but excluded components less than 0.5 in. nominal pipe size (according to Method 21).
The component counts presented in Table 1 include components less than 0.5 in. nominal pipe size. Overall, 13.8% of these component counts are components less than 0.5 in. nominal pipe size.
The component counts are not complete for Sites 1, 2, and 4 because not all components in hydrocarbon liquid service were counted at these locations. This would tend to make the discrepancy even greater.
Loss, emission inventory
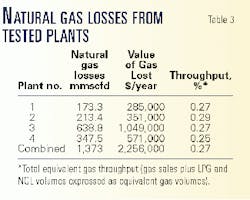
Tables 3 and 4 summarize total natural gas losses at the four gas processing plants and present estimated value of these losses based on a gas price of $4.50/Mscf.
These losses include direct leakage or venting of natural gas to the atmosphere as well as losses into the process that yield no benefit (for example, excess fuel consumption by out-of-tune or inefficiently-operated engines and heaters, and gas leakage into flare systems).
Total atmospheric emissions from these losses will differ in that some of the lost gas is emitted as combustion products rather than directly as natural gas.
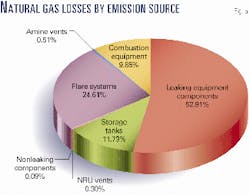
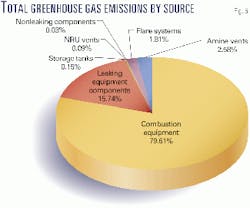
Figs. 5 and 6 show the relative distribution of natural gas losses and total greenhouse gas emissions by source category. Leaking equipment components and leakage into flare systems are the major sources of natural gas losses at the gas plants.
Fuel consumption by combustion equipment is, by far, the largest source of greenhouse gas emissions. Equipment leaks are, however, also an important source of greenhouse gas emissions.
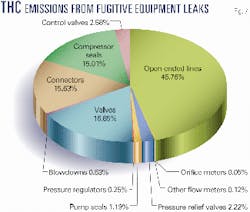
Open-ended lines contribute most of the emissions from equipment leaks, although valves, connectors, and compressor seals are also noteworthy sources (Fig. 7). The top ten leakers at each site contributed more than half of the total emissions from fugitive equipment leaks (Table 5).
Carbon dioxide equivalent greenhouse gas emissions are calculated with the most recent 100-year global warming potentials (1 for CO2 and 21 for CH4).5 The methane content of the measured total hydrocarbon (THC) emissions was determined by typical gas analyses for the site or by analysis of samples collected during the measurement program.
Emissions of nitrous oxide have not been evaluated but likely contribute only a few percent of total greenhouse-gas emissions at each site.
Control opportunities
Practicable opportunities for reducing emissions from fugitive equipment leaks and process venting were identified and assessed on a source-by-source basis. The sources with the greatest emissions were not necessarily the most economical to repair or replace.
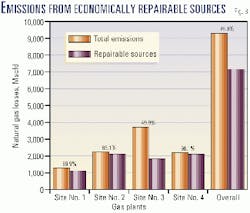
Fig. 8 shows that roughly three-quarters of the identified natural gas losses at the surveyed gas plants were economical to avoid or recover based on preliminary estimates of repair costs.
It was assumed that a leak, once repaired, will remain fixed for some time, and then will recur. The mean time between failures depends on the type, style, and quality of the component, the demands of the specific application, component activity levels (number of valve operations), and maintenance practices at the site.
Table 6 provides the estimated mean time between failures for each type of component. These values are crude estimates based on the experiences of the authors and limited feedback from the host facilities.
Click here to view Table 6
This survey is in PDF format and will open in a new window
The relatively low mean time between failures for connectors reflects wear and tear on these components from inspection and maintenance of associated equipment units.
In a formal leak detection and repair program, mean times between failures is tracked on an ongoing basis and are used to identify problem service applications and to evaluate the potential need for changes to component specifications and maintenance practices.
References
- US Environmental Protection Agency, Protocol for Equipment Leak Emission Estimates. Available through NTIA. Springfield, Va. Publication No. EPA-453/R-95-017, Section 2, 1995.
- US Environmental Protection Agency and Gas Research Institute. Methane Emissions from the Natural Gas Industry, Vol. 8: Equipment Leaks. Available through NTIA. Springfield, Va. Publication No. EPA-600/R-96-080h.1996
- US Environmental Protection Agency, Method 21 - Determination of Volatile Organic Compound Leaks, 1997. Available at www.epa.gov/ttn/emc/promgate.html.
- US Environmental Protection Agency and Gas Research Institute, Methane Emissions from the Natural Gas Industry, Vol. 8: Equipment Leaks, Report No. EPA-600/R-96-080h, Research Triangle Park, NC, 1996.
- IPCC, Climate Change 1995, The Science of Climate Change. New York, Cambridge University Press, 1996.
- Stone, D.K., Lynch, S.K., Pandullo, R.F., Evans, L.B., and Vatavuk, W.M., Flares, "Part I: Flaring Technologies for Controlling VOC-Containing Waste Streams," Journal of Air and Waste Management Association, Vol. 42 (1992), No. 6. pp. 333-40.
The authors
Carolyn Henderson is a program manager for the Natural Gas Star Program at the US Environmental Protection Agency, Washington. She holds a bachelors (1988) from Stanford University and a masters (1998) from the University of California at Berkeley.
Jeff Panek is principal project manager for air quality in environmental programs at the Gas Technology Institute, Des Plaines, Ill. Before joining GTI, he spent about 10 years with BP Amoco Corp., rising to the position of air programs coordinator supporting exploration and production, refining, marketing, pipeline, and chemical operations. He also worked at NUS Corp. as a meteorologist, 1986-90, and Burns & McDonnell Engineering and Consultants as an air-quality analyst, 1985-86. Panek holds a BS (1985) in meteorology from Northern Illinois University and has pursued graduate studies in environmental engineering at the Illinois Institute of Technology.
David Picard is a principle at Clearstone Engineering Ltd., Calgary. He holds a BS (1981) in mechanical engineering from the University of Alberta and an MEng (1985) in chemical engineering from the University of Calgary
Marline Smith is a project engineer at Clearstone Engineering Ltd. She holds a BASc (1995) in chemical engineering from the University of British Columbia and an MSc (1997) in chemical engineering from the University of Calgary.
