PERMAFROST PIPELINING - Conclusion: Instrumentation yields geotechnical picture of slope movements along northern Canadian pipeline
Inertial pigging of a short section on the 323-mm (12 in. nominal) OD Norman Wells crude oil pipeline from Norman Wells, NWT, to Zama, Alta., revealed the line had experienced an increase in internal diameter, suggesting a localized wrinkle.
Enbridge Pipelines (NW) Inc., Edmonton, owns and operates the buried oil pipeline, which operates at ambient temperatures. Built in 1985, it is the first fully buried pipeline in discontinuous permafrost in North America.
Part 1 (OGJ, May 14, p. 62) of this two-part series provides a full discussion of the background of the problem and the resulting remediation program. This concluding article focuses on the instrumentation at the site and what was learned about the geotechnical aspects of the wrinkle formation.
Slope and pipeline instrumentation installed at the site during an investigative dig was monitored for 1 year before the wrinkled section was excavated and replaced. Following pipe replacement, additional slope indicators were installed, along with thermistor cables to monitor the performance of the slope.
The slope indicators show that some "creep-like" movement was taking place. Numerical modeling of potential loading mechanisms showed that a combination of deep burial, thaw settlement, and mass movement of the soil could strain the pipe to the point of yielding.
Slope design
There are about 150 slopes along the 869-km (540-mile) pipeline that warranted special attention during design and construction. For certain more-critical frozen slopes, wood chip insulation was placed on the slopes following construction to retard the rate of thawing of the permafrost.
Hanna and Oswell provide review and discuss the performance of the slopes.1 2
Data assessment of yearly inertial pigging surveys indicated that higher than desirable strains had developed along the pipeline at several locations, mainly on short shallow permafrost slopes.
It was noted that the wrinkle occurred adjacent to a weld on a steeply sloped portion of the pipe.
The slope, at KP 318 near Wrigley, NWT, was in permafrost at the time of design and construction in 1985. The soil conditions consist of silty clayey soil containing moderate to high ice contents, with a colluvial mantle. Ditch logs from construction indicated ice contents of 20% at this site.
The northwest-facing slope is 40 m long and a maximum slope angle of about 13. The right-of-way on the slope is about 13 m wide. About 1 m of wood chips was placed on the slope following backfilling of the ditch to provide insulation to reduce the rate of thaw.
Instrumentation
When the inertial pigging tool detected the wrinkle on the pipe, an investigative dig took place in February 1998, as described in Part 1. Pipe and slope instrumentation installed at that time is described here.
Pipe-deflection indicators
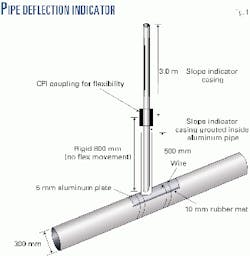
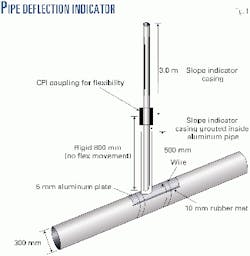
Fig. 1 shows a schematic of the pipe-deflection indicators, designed to indicate bending of the pipeline in response to either heaving or settling motions.
The instruments consisted of a section of standard 75-mm diameter plastic slope-indicator casing, about 1 m long, housed in an aluminum casing welded to an aluminum saddle. The angle of the casing, relative to the saddle, was fixed at 22, the approximate average inclination of the pipeline near the wrinkle.
(On the lower portion of many slopes along the pipeline, the pipe was as much as 3-4 m deep. It was inclined much more steeply than the slope surface due to the requirement to achieve a design depth of cover of 1.5-2 m over the pipe at all creek crossings.)
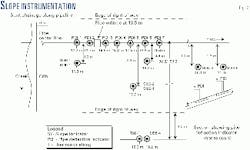
A 10-mm thick rubber mat was placed between the aluminum saddle and the pipeline, and the assembly was held in place by plastic straps around the pipe. Seven pipe deflection indicators were installed (Fig. 2).
The instruments were protected from the surrounding soil by a 300-mm polyvinyl chloride (PVC) pipe that extended to the ground surface, which also allowed the slope-indicator probe to be inserted into the casing.
Slope indicators
Slope indicators are intended to measure displacements of soil masses or retaining-wall structures. This is achieved by installation of a casing in a borehole and use of an instrumented probe to make successive measurements of the tilt of the casing.
The casing is installed through the soil mass that is suspected of movement and anchored into stable soil below a presumed plane of movement. Successive readings and integration of the incremental displacement along the casing length yield information on the accumulated displacement and the zone of movement.
Immediately after the investigative dig in February 1998, five slope indicators were installed to depths of 8-12 m. Fig. 2 shows their locations.
Two new slope indicators were installed in March 1999 to replace installations destroyed during the 1999 pipe replacement. These instruments, SI99-1 and SI99-2, were in the same general locations as SI98-1 and SI98-2, respectively, but were slightly deeper, at 12-13.5 m.
Thermistors
Following the investigative dig, two deep thermistor cables were installed; Fig. 2 shows their locations.
Thermistor 98-1, on the right-of-way near SI98-2, extended to 8 m below the mineral ground surface, and Thermistor 98-2, off the right-of-way, extended to a depth of 10.5 m.
Two new thermistor cables were installed in March 1999 near the two new slope indicators to depths of 11 m and 12 m, respectively.
Results-indicators
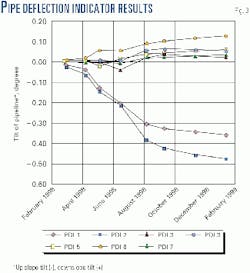
Fig. 3 shows the change in alignment of the pipeline during the 1 year between the investigative dig and replacement. Pipe-deflection indicators Nos. 1 and 2 were below the wrinkle, while pipe-deflection indicators Nos. 3-7 were above the wrinkle.
It is apparent that the section of the pipe downslope of the wrinkle continued to rotate counter clockwise (if on the east side of the pipe and looking west), while the section of the pipeline above the wrinkle either remained stable, or rotated slightly clockwise.
These data suggest that the wrinkle, which was on the top of the pipe, continued to develop.
The pipe-deflection indicators have proven to be a useful in this situation for short-term monitoring of in-line rotation of the pipeline.
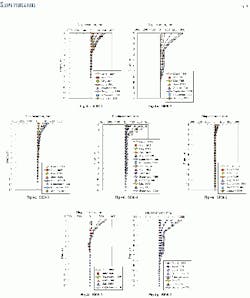
Fig. 4 shows the slope indicator plots with the latest available data (to the fall 2000). For brevity, the usual companion plots of displacement perpendicular to the downslope direction have been omitted.
The data collected during 1998 for the lower portion of the slope (Figs. 4a, 4b, and 4c) showed two distinct movement zones. The upper zone is occurring at depths of 3.5, 3, and about 3 m in SI98-1, 2, and 3, respectively.
This movement is associated with the settlement of the trench backfill after the investigative dig. This can also be observed in "perpendicular to downslope" movement (not included), which shows movement of the slope indicator casing towards the pipe.
The second movement zone appears to be at a depth of about 6-6.5, 8-8.5, and 5-6 m in SI98-1, 2, and 3, respectively (Figs. 4a, 4b, and 4c). This movement is, in all three cases, much deeper than the pipe or base of the trench.
No corresponding lateral movement towards the trench is observed at this deeper zone. No movement is observed at this deeper zone in the slope indicator, SI98-5, near the top of the slope, either downslope or laterally (Fig. 4e).
The 1999 slope indicators, SI99-1 and 2, were installed near their corresponding 1998 casings, except deeper. Figs. 4f and 4g show the downslope movements of the casings.
The movement in SI99-1 is difficult to interpret. Ground settlement following the pipe replacement in 1999 was extensive, and the "whiplash" behavior observed at 6 m depth may be casing compression within the borehole. Readings during February 2000 were impossible because the upper part of the casing had filled with ice (including the 1.5 m section above the ground surface).
The movement pattern of SI99-2 (Fig. 4g) is generally similar to that of SI98-2. Two movement zones are apparent, one at about 3 m depth and a second deeper zone, interpreted here to be between 6.5 and 8.5 m.
If the two sets of slope indicator data are taken together, the downslope movement between March 1998 and February 2000 is in the order of 225 mm at a depth of 5 m. Plotting the movement vs. time for the 5 m depth yields Fig. 5; in the year following the pipe replacement, the slope movement appears to accelerate in 1999.
More recently, the rate of movement appears to have decreased to about 5.5 mm/month, which is similar to the rate observed in the first year.
Fig. 4d presents the slope indicator data off the right-of-way. These very interesting data show the initiation of downslope movement after an initial period of essentially no movement. The readings between March 1998 and January 1999 show the casing to be stable over its full depth below a depth of about 1 m.
The readings since January 1999, however, indicate an increased amount of movement. The zone of movement is interpreted to be between 8 and 9 m and represents about 25 mm of movement at the 5 m depth, as seen in the displacement over time (Fig. 5).
This zone of movement is the same as that interpreted in SI99-2, which is directly lateral to SI98-4 but closer to the pipe. The rate of movement during the spring and summer 2000 is about 0.3 mm/month.
Thermistors
The pipe temperature during March 1998 to January 1999 was monitored by a thermistor bead taped to the bare pipe steel. It showed an 11-month average temperature of about +2° C. During summer, the pipe temperature reached as high as +8° C.
The pipe temperatures are very consistent with the oil temperature entering the Wrigley pumping station (approximately 20 km downstream).
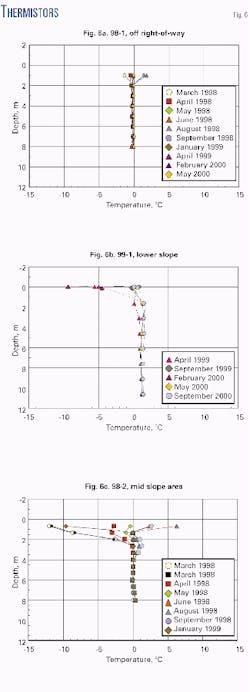
Fig 6 presents the thermistor data. Thermistor 98-1 (Fig. 6a) shows ground temperature data off the right-of-way. This thermistor shows the ground temperatures to be uniform with depth and marginally frozen for the most part.
Towards the middle of the slope, Thermistor 98-2 (Fig. 6c) indicates frozen ground between 3 and 7 m depth, with the ground temperature rising slightly above 0° C, below 7 m. The seasonal variation above about 3 m is likely greater than normal due to the influence of the pipe temperature.
Thermistor 99-2 (not shown), which is near the previous Thermistor 98-2, is unexpectedly indicating unfrozen conditions, even though ice crystals were noted on the borehole log. The observed temperatures can be explained as follows:
When the original thermistor cable (T98-2) was installed at this location, its depth was approximately 8 m. In contrast, when the replacement thermistor (T99-2) was installed, its depth was approximately 12 m. During the drilling for this latter thermistor, a wet gravel seam at depth was penetrated.
It is believed that groundwater in this gravel may be under artesian pressure (as evinced by water and ice filling the downslope slope indicator). This water may be seeping through the sand backfill in the borehole in which the new thermistor cable was placed, causing the previously very warm but slightly frozen soils to thaw locally.
Thus, it is believed that this portion of the slope is frozen except for the immediate vicinity of the borehole. The slope has thawed or warmed up since construction.
The slope indicators clearly indicate slope movement both at the relatively shallow depth of 3-4 m and at depths of 5-8 m. The lower movement zone is related to creep displacement near the base of the permafrost.
Interaction study
An important issue is whether the slope movement was sufficient to induce the wrinkle observed in the pipe. To help address this question, a soil-pipe interaction study was undertaken.
The study, using the finite-element program PIPLIN, considered several variables that affect strain development in pipelines including depth of burial, thaw settlement, axial loading due to slope movement, and others. The physical evidence at the site clearly showed that the pipeline was subjected to axial stresses.
The investigative dig of the wrinkles in February 1998 revealed numerous scars and tears in the pipe jacket. These markings were as long as 0.6 m along the length of the jacket. The length, frequency, and severity of the scars and tears increased as one approached the wrinkle.
Downslope of the wrinkle, the number and length of the scars greatly reduced. (The maximum slope movement evinced by the markings on the pipe jacket are generally consistent with the observed movement from the slope indicators.)
Initial numerical analyses clearly showed that the expected soil loadings and displacements on the slope situation could easily result in wrinkling pipe strains close to the design limit of 0.5%.
It was of some concern, however, that the peak strains developed at an existing field sag bend, whereas the actual KP 318 wrinkle occurred at an sag bend induced by pipe movement.
This may be due to such other factors as material properties in the vicinity of the weld or alignment imperfections that could have acted as a trigger. It was considered worthwhile, however, to examine other possible pipe-soil interaction cases.
The pipe was assumed to be fully constrained horizontally at the downslope end of the model. It was also assumed to be reasonably constrained vertically by the unfrozen soil spring beneath.
At the crest of the slope, the pipe would be reasonably restrained horizontally by virtue of the axial restraint of the soil on the overland portion. Vertically, the pipe at the crest, and indeed over the majority of the slope, would be free to move downwards as a result of certain thaw settlement.
If the slope geometry is simplified as a triangle with 100 m length and 20 m vertical dimensions, the sloped portion is 101.98 m long. If one assumes, for example, 200 mm (8 in.) of thaw settlement over the whole slope, the vertical height of 20 m reduces to 19.8 m and considering that the pipe at the bottom of the slope is well anchored, the sloped portion of the pipe is "forced to become" 101.94 m long.
This shortening of the pipe by 40 mm (1.6 in.) over the sloped portion, results in a compressive stress that, assuming elasticity, can be translated into an extra axial compressive force of about 570 kN.
This is at least double the amount of maximum cumulative compressive force being applied for slope movement alone (271 kN). Hence, there seemed to be some justification for considering a greater axial loading.
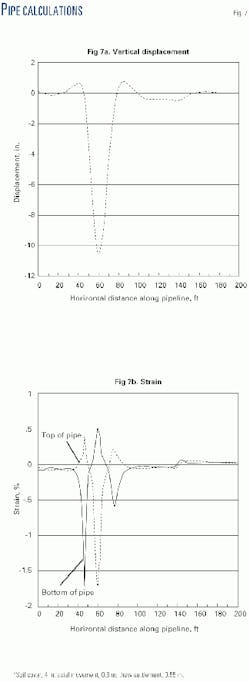
The analysis combined the slope movement and this new overall thaw-settlement force with the localized differential thaw-settlement displacement in simultaneous steps, with a maximum 11 in. of settlement displacement.
Fig. 7a shows that under the greater axial load, the pipe displaced essentially the full 11 in., compared to only about 4 in. for the analysis conducted without the "benefit" of additional axial loading. In Fig. 7b, the pipe strains are also considerably greater than for the case without axial loading.
Of most significance is that the peak strain at the created sag bend is well into the wrinkling strain level. It is possible that in the real field case, the strain could for certain reasons concentrate at a particular developing bend, thus alleviating the straining at an adjacent developing bend.
It is concluded that short slopes may be more vulnerable to the type of loading combinations being experienced at KP 318. On short slopes, there is less opportunity for the pipe to release built-up (or developing) strains at roping bends that would be available on longer slopes.
From the outset of this situation at KP 318, it had been thought somewhat unusual that such problems were occurring on essentially insignificant slopes compared to many longer, steeper slopes with no apparent pipe distress.
The fact that a significant pipe strain has been achieved at the created sag bend suggests that there is perhaps more axial load in the pipe at KP 318 than had been expected. At least, this seems a possible alternate to some other causes that have been indicated-pipe properties, material, or alignment imperfections.
Thus, it is concluded that several factors may be acting to promote the conditions necessary for the formation of wrinkles. The presence of a weld can also be a trigger in such pipe displacement.
It is likely that the circumstances that have developed at this site could be present or developing at other sites, and the PIPLIN study has helped develop some screening criteria for identifying other potential at-risk sites.
Enbridge has and will continue to enhance the monitoring and surveillance program for early identification of at-risk sites to ensure the safety of the pipeline and environment.
Acknowledgment
The authors thank Enbridge Pipelines Inc. for permission to publish this article.
References
- Hanna, A.J., Oswell, J.M., McRoberts, E.C., Smith, J., and Fridel, T., "Initial Performance of Insulated Permafrost Slopes, Norman Wells Pipeline Project, Canada," 7th International Cold Regions Conference, Edmonton, 1994.
- Oswell, J.M., Hanna, A.J., and Doblanko, R.M., "Update of Performance of Slopes on the Norman Wells Pipeline Project," 7th International Permafrost Conference, Yellowknife, NWT, 1998.
The authors
James M. Oswell is regional manager at AMEC Earth & Environmental Ltd., Calgary. He has more than 15 years of geotechnical and permafrost experience with a technical focus on pipelines in cold regions. He holds a BEng from Lakehead University (1982), an MSc (geotechnical engineering) from the University of Calgary (1984), and a PhD (geotechnical engineering) from the University of Manitoba (1991). He is a registered professional engineer in several jurisdictions and active in the Canadian Geotechnical Society.
Alan J. Hanna, with nearly 30 years of international permafrost experience, is a permafrost specialist with AMEC Earth & Environmental Ltd., Calgary. He holds a BAI, BA (1968) from the University of Dublin and an MASc (1976; geotechnical engineering) from the University of Ottawa. He is former chair of the Cold Regions Division of the Canadian Geotech nical Society and a member of the International Permafrost Association, Canadian Section.
Scott A. Wilkie is a project engineer with Enbridge Pipelines Inc. in Edmonton and maintains and manages the monitoring and surveillance program related to the Norman Wells pipeline. He holds a BSc (1996) in civil engineering from the University of Alberta. He is a registered professional engineer in Alberta.
Richard M. Doblanko is an engineering specialist at Enbridge Pipelines Inc. with more than 12 years' experience in pipeline engineering, construction, and operations. He holds a BSc (1989) in mechanical engineering from the Uni versity of Alberta and an engineering design and drafting diploma from the Northern Alberta Institute of Tech nol ogy (1980). Doblanko is a registered professional engineer and certified engineering technologist in Alberta.
