Detecting hydrocarbon microseepage using hydrocarbon absorption bands of reflectance spectra of surface soils
The microseepage of gaseous hydrocarbons often creates a soil atmosphere containing lighter hydrocarbons (C1-C5). The gases in the soil may be sampled and analyzed to determine the specific mix of hydrocarbons using a gas chromatograph.
These same hydrocarbon gases are also adsorbed by clay particles in the soil. Soil samples then may be collected and analyzed for gas content using a gas chromatograph, or in this case, a hyperspectral spectrometer. The reducing environment between the reservoir and the surface along with some associated chemical changes may also be detectable. For example, iron often reduces from a ferric to a ferrous state, and minerals such as feldspars and micas may alter to clays. These changes, when present, can also be detected by spectral analysis of soil.
Studies show that the clay and iron mineral alterations mentioned above change the spectral reflectance of the surface soils and can be detected with a hyperspectral spectrometer.1 This phenomenon has been utilized by explorationists, primarily in the mineral industry, using both portable field spectrometers and airborne imaging spectrometers.
The technology leading to hyperspectral spectrometers with bandwidths from 3-10 nanometers has made it possible to find very subtle changes in the reflectance of a substance. The changes detected usually consist of increased energy absorption within a narrow range of wavelength bands.
The increased absorption in the reflectance curve may be interpreted as an increased concentration of ferrous iron or clay depending on the wavelength. For example, reduced iron has a fairly broad absorption band in the near infrared centered at 860 nm.2 The wavelength of clay absorption occurs around 2,210 nm, but varies somewhat with the type of clay.3
HC reflectance spectra
The purpose of this article is to show that hydrocarbon molecules adsorbed to soil particles can also be detected by measuring the spectral reflectance of soils. The wavelengths absorbed by hydrocarbons in the 400-2,500 nm range vary little from one type of hydrocarbon to another.
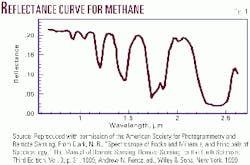
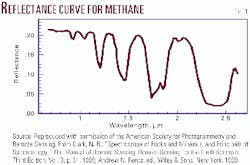
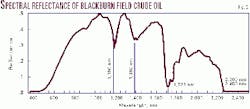
There are four distinct absorption bands, in the infrared range from 1,100-2,500 nm, which are strong enough to be diagnostic when analyzed together. Fig. 1 shows the reflectance curve for methane,4 and Fig. 2 shows a curve measured by one of the authors for the light crude oil from Blackburn oil field in central Nevada. The absorption bands in each vary slightly in the wavelength of the exact start and end of the absorption band, but the positions are essentially the same.
The same is true for other hydrocarbon reflectance curves, such as ethane, pentane, octane, heptane, and hexane found in the "Atlas of Near Infrared Spectra."5
Of the four distinct hydrocarbon absorption bands, two bands, 1,180 nm and 1,380 nm, are narrow and sharply defined, though fairly weak, about 20% absorption. The other two are broader, but much stronger with the 1,680-1,720 nm band showing about 65% absorption and the 2,300-2,450 nm band reaching 95% absorption.
Because other minerals may have absorption bands coincident with one of these hydrocarbon absorption bands, it is important to look at each of the hydrocarbon bands to make a definitive analysis. For example, calcium carbonate absorbs at 2,335 nm, which partly corresponds with hydrocarbons at 2,300-2,450 nm, but not at 1,680-1,720 nm, which is associated only with hydrocarbons.
If only the strongest hydrocarbon absorption band were analyzed, a high concentration of calcium carbonate could be interpreted as hydrocarbon, and a strong result in the analysis would be ambiguous. By looking at four hydrocarbon absorption bands, compounds other than hydrocarbons may be eliminated and provide confidence in the interpretation.
Field investigations
Three field studies were conducted in oil or gas producing areas to see if spectral reflectance analysis of soils could detect the presence of hydrocarbon absorption bands and define the producing area.
Two areas are oil producing: Blackburn oil field, Eureka County, Nev., and Trap Spring oil field, Nye County, Nev. One site is gas producing: Big Indian (Hermosa) gas field, San Juan County, Utah.
Soil samples were collected on transects through each producing area.
Soil preparation
Each soil sample was sieved to assure ample quantity of fine material in the sample. The fine material was poured onto a flat surface and pressed under a glass for analysis by the spectrometer. Isolation of the fine grain soil material assures clay particles predominate in the sample.
Clay particles are important in themselves when looking for clay alteration and are also the particles to which other elements may be most readily adsorbed.
Spectral data collection
An ASD (Analytical Spectral Devices) full-range spectrometer was used to collect data for the wavelength range 350-2,500 nm.
The light source is a quartz halogen light probe to assure that the sample is illuminated by a single controlled light with no stray light from other sources. This arrangement also provides a consistent geometry of light source and sensor orientation for each sample. The ASD spectrometer has spectral resolutions of 3 nm in the visible/near infrared (VNIR) and 10 nm in the shortwave infrared (SWIR).
Data analysis, interpretation
Data analysis consisted of appropriate data ratios for observing the absorption bands of hydrocarbons. Use of ratios demands that the wavelength used for the numerator be one which tends not to be affected by absorption from any other materials.
In this analysis, 1,650 nm was used as the numerator in the shortwave infrared. This wavelength is not affected by most minerals, and it is usually a highly reflective portion of the spectrum. This simple method of data analysis proved very effective. Other methods involving some type of waveform analysis resulting in a curve similarity index could also be used.
Interpretation consists of making a graph of the transect of ratioed data values. The ratios are set up in such a way that sample points with stronger absorption show up as peaks on a graph.
The magnitude of the hydrocarbon peaks in the graphs are strictly relative as there is no threshhold of ratio values that is evidence of hydrocarbon absorption. The weaker positive ratio values may be no less significant than the stronger values and are likely related to variations in fracturing of the underlying strata.
It is interesting to note that some transects exhibit halo type anomalies, while others show anomalies directly over the oil field. This variation in the pattern of anomalies is addressed in discussions of the theories of hydrocarbon microseepage by various authors6 7 8 and must be considered during interpretation.
Blackburn oil field
Production in Blackburn field comes from a horst block that slid westward along a low angle detachment fault during extensional faulting.9 10
The horst block is now buried under approximately 6,000 ft of Tertiary silt and clay alluvial valley fill in Pine Valley, Nevada. The Blackburn field reservoir is Devonian age carbonates of the Nevada Group. The oil produced is 24-30° gravity with no associated gas.
The sample traverse through Blackburn field was oriented roughly E-W with soil samples taken at 1,000 ft intervals at the outer two sample sites at each end of the transect, with the remainder taken at 500 ft intervals. The graphs of hydrocarbon absorption, Fig. 3A, B, and C, show high ratio values over the production area with pronounced lows immediately on either side.
The evidence for strong absorption at sample sites 1 and 2 has repeatedly appeared in other studies in the area and suggests more rapid hydrocarbon leakage along the buried near-vertical fault to the west of the oil field.10 Fig. 4 shows Flanigan's map with the soil sample sites superimposed. Note that sample 2, which shows a marked high ratio in Fig. 3C, is coincident with the fault as mapped.
Trap Spring oil field
Production from Trap Spring field is in a southeast dipping homocline bounded on the west (updip) by a series of strike-parallel faults in Railroad Valley, Nevada.
Tertiary valley fill ranging from 2,000-5,000 ft covers the producing zone.11 The oil reservoirs in Trap Spring field are welded ash flow tuffs of the Garrett Ranch Group. Production is lower gravity (21-26°) oil with no associated gas.
Hydrocarbon absorption data from Trap Spring oil field (Fig. 5) show a halo type anomaly rather than the apical anomaly seen at Blackburn field (Fig. 3).
The E-W transect through the field has 1,000-ft intervals throughout, except for sites 5-8 on the west and sites 15-18 on the east. Closer spacing at those sites was made to make sure the edge of the field was detected.
The weaker absorption bands (1,180 nm and 1,380 nm) actually showed both boundaries of the field clearly (Figs. 5A, 5B). The strongest absorption band (2,300-2,450 nm) shows evidence of hydrocarbon leakage along the west edge of the field at the updip edge of the reservoir. It might be expected that leakage would be greatest on the updip side, where hydrocarbons may seep in greater quantities along the bounding fault planes.
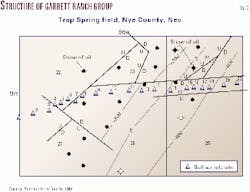
Fig. 6 shows the structure of Trap Spring field with soil sample sites added. Note that samples 5, 6, and 7 define the west limit of production and are also coincident with a fault. The absorption band at 1,723 nm (not shown) is weakly supportive of the other wavelengths but not definitive alone.
Big Indian (Hermosa) gas field
Big Indian gas field consists of a gas well on the east flank of a collapsed salt anticline in Lisbon Valley, Utah.12
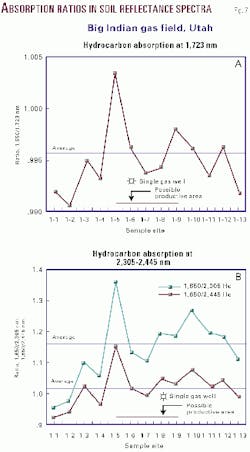
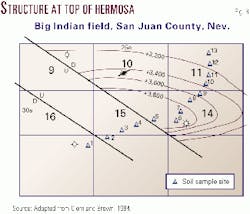
Production is from a structural-stratigraphic trap in the Hermosa clastic section with the salt of the salt anticline forming the seal in the updip direction. The fault along the edge of the salt collapse accounts for the updip leakage at sample site 5 on the graph (Fig. 7). Two hydrocarbon absorption bands, 1,723 nm and 2,300-2,450 nm, show a halo pattern which includes the existing gas well along the transect.
Based on the pattern of the anomaly, it would appear that there is potential for additional development of the gas field. In this case, the weaker absorption bands, 1,180 nm and 1,380 nm, showed a suggestive but not definitive pattern on the graphs. Fig. 8 shows the structure at the top of the Hermosa with soil sample sites added. Note that sample site 5 is at the updip edge of the structure coincident with the fault.
HC exploration application
This analysis of spectral reflectance of soil samples presents a strong case for the detection of hydrocarbons adhered to clay particles in the soil horizon often associated with hydrocarbon microseepage. Though not discussed in this article, there was also a distinct correspondence between hydrocarbon absorption bands and clay alteration bands and with iron reduction bands in most cases.
While this technique has definite utility in its present stage of development, the future potential for this technique lies in the use of airborne imaging spectrometers to map the areal extent of hydrocarbon anomalies.
The technique has applications in oil and gas exploration, in the detection and mapping of soil contamination sites, and in detection of pipeline leakage.
In order to fully realize this potential in all environments using airborne hyperspectral scanners, it will be necessary to study the effects of hydrocarbon microseepage on the spectral reflectance of vegetation as well as soils. For now, the spectral reflectance of soil using a portable spectrometer provides a valuable means of detecting hydrocarbon microseepage.
References
- Merin, I.S., and Segal, D.B., "Diagenetic alteration of the Wingate formation; possible indications of hydrocarbon microseepage, Lisbon Valley, Utah," Journal of Geology, Vol. 97, 1989, pp. 719-734.
- Hunt, G.R., "Spectral signatures of particulate minerals in the visible and near infrared," Geophysics, Vol. 42, No. 3, 1977, pp. 501-513.
- Hunt, G.R., "Near-infrared (1.3-2.4µm) spectra of alteration minerals-potential for use in remote sensing," Geophysics, Vol. 44, No. 12, 1979, pp. 1,974-86.
- Clark, N.R., "Chapter 1: Spectroscopy of Rocks and Minerals, and Principles of Spectroscopy, Remote Sensing for the Earth Science," Manual of Remote Sensing, 3rd ed., Vol. 3, edited by Andrew N. Rencz, John Wiley & Sons Inc., New York, 1999, pp. 3-58.
- Sadtler Research Laboratories, "The Atlas of Near Infrared Spectra," Philadelphia, 1981.
- Klusman, R.W., "Soil Gas and Related Methods for Natural Resource Exploration," John Wiley & Sons Ltd., West Sussex, England, 1993.
- Tedesco, S.A., "Surface Geochemistry in Petroleum Exploration," Chapman and Hall, New York, 1995.
- Price, L.C., "A critical overview of and proposed working model for hydrocarbon microseepage," US Geological Survey Open File Report 85-271, Denver, 1985.
- Hulen, J.B., Bereskin, S.R., and Bortz, L.C., "High-temperature hydrothermal origin for fractured carbonate reservoirs in the Blackburn oil field, Nevada," AAPG Bull., Vol. 74, 1990, pp. 1,262-72.
- Flanigan, T.E., "Blackburn field: Oil above a low angle detachment fault in Eureka County, Nevada," in Schalla, R.A., and Johnson, E.H., eds., "Oil Fields of the Great Basin," Nevada Petroleum Society, Reno, 1994, pp. 343-359.
- French, D.E., "Petroleum geology of Trap Spring field, Nye county, Nevada," in Schalla, R.A., and Johnson, E.H., eds., "Oil Fields of the Great Basin," Nevada Petroleum Society, Reno, Nev., 1994, pp. 259-269.
- Clem, K.M., and Brown, K.W., "Petroleum Resources of the Paradox Basin, Big Indian field," Utah Geological and Mineral Survey, Bull. 119, 1984, pp. 26-27.
The authors
Roger McCoy is an emeritus professor at the University of Utah. He has worked with remote sensing research for 35 years and with the surface effects of microseepage for more than 15 years. He has a PhD degree from the University of Kansas and a BS degree from the University of Oklahoma. E-mail: [email protected]
Jason G. Blake is a consulting geologist and president of Titan Energy Resources, which generates oil and gas prospects mainly in the Rocky Mountain region. He has been involved with Roger McCoy investigating techniques for the detection of hydrocarbon microseeps for more than 15 years. He holds a BS degree in geology from Northern Arizona University. E-mail: [email protected]
Kathryn L. Andrews is a geographic information systems and remote sensing specialist with the Bureau of Land Management in Salt Lake City. She uses global positioning systems and GIS in resource mapping projects. She has a BS degree in geography from the University of Utah and recently completed an MS degree focused on reflectance spectroscopy and trace element analysis applied to detection of hydrocarbon microseepage anomalies in Blackburn field, Nevada. E-mail: [email protected]
