Flow simulations give refiner capacity, product-quality gains
During the past 5 years, Mobil has achieved tens of millions of dollars in capacity and product-quality gains by using computational fluid dynamics (CFD).
Mobil has used CFD to improve performance of refinery process equipment such as reactors, separators, and extractors.
Low-cost debottlenecking, a key initiative throughout the refining industry, usually involves simple process-hardware changes. These changes may improve fluid-flow patterns to enhance reaction rates, mixing, heat and mass transfer, phase contacting or segregation, and surface or interface renewal.
CFD is the tool of choice for many refining problems. Experimental flow studies cannot always capture all of the relevant physics within typical cost and time constraints. Sometimes, physical measurements do not give a complete picture of why a particular design does or does not work.
Recent advances in the CFD field allow analyses of problems of increasing complexity, such as those involving reactions, multiphase flows, moving boundaries, and complicated geometries.
The highly detailed results of a CFD simulation allow visualization of flow patterns in even the most inaccessible locations of a complex fluid-flow system. These visual images provide both design guidance and insight into the origin of important flow features.
Since the mid-1990s, Mobil has used the software package Fluent licensed through Fluent Inc., Lebanon, NH, to solve hardware design problems where improving fluid flow is paramount.
The company has completed more than 50 complex projects in 5 years using Fluent, including 2D and 3D geometries, coupled flow and heat transfer, reacting flow, free-surface flow, immiscible two-liquid flow, and granular multiphase flow. Together these cases illustrate the range of capabilities provided by the Fluent package as well as the power and versatility of CFD analysis.
This article uses five examples to illustrate CFD simulations that resulted in major benefits for oil refinery operation and equipment design:
- Increasing fixed-bed reactor catalyst capacity.
- Boosting FCC air-blower efficiency.
- Augmenting furnace output.
- Optimizing phase-contactor effectiveness.
- Improving fluidized-bed FCC regenerator performance.
Particularly useful is CFD's evaluation of design methods based largely on empiricism or history, which frequently turn out to be insufficient when stretched over the broader range of application demanded by modern refining practice.
Increasing catalyst capacity
An example of a simple CFD simulation with high payout for Mobil was analysis of gas-flow patterns in a spherical reactor vessel containing a fixed bed of solid catalyst.
The height of the catalyst load determines the trade-off between allowable feed rate and reactor-cycle length (the time the reactor can operate within product specifications prior to catalyst changeout).
Feed gas enters the top of the vessel through a single central inlet and diffuser. Some empty space is necessary to dissipate inlet momentum and disperse the gas over the full bed area.
If the catalyst level in the reactor is too high, feed gas may jet into only part of the bed and bypass other regions, reducing effective catalyst volume. Jetting may also grind the catalyst particles, generating fine dust that can foul the bed and force a premature shutdown.
In this example, the refinery wanted to increase reactor throughput without shortening cycle length. Bed height was already at the maximum, however, dictated by a rule-of-thumb for required free space below the inlet diffuser.
Mobil engineers used CFD to determine rigorously whether catalyst height could be increased while preserving good inlet-gas distribution.
Analysts evaluated gas-flow patterns for various levels of catalyst fill, both in the vessel headspace and through the packed bed. Critical to the simulation was Fluent's porous media model, which made it possible accurately to capture the effects of several catalyst particle sizes on flow lines and pressure drop.
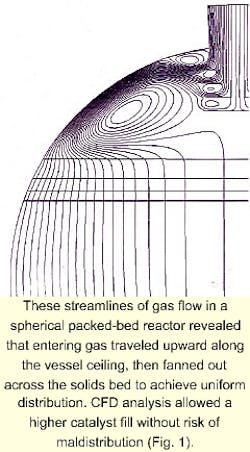
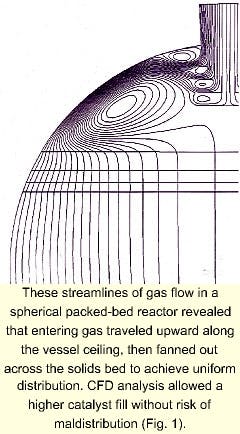
The model showed that the diffuser created an unusual flow pattern that resulted in even gas distribution over the full cross-section of the reactor (Fig. 1). The gas was able to penetrate the catalyst uniformly from a very short height.
The CFD findings thus disproved the empirical guideline for inlet-diffuser clearance. The results demonstrated that it was possible to fill this and other spherical reactors to greater heights without concern.
Mobil increased the catalyst volume of this vessel by 10%, increasing annual revenue from this single reactor by $2.2 million.
Boosting blower efficiency
In another example, Mobil studied flow in the suction line of the main air blower feeding the regenerator of a fluid-catalytic cracking unit (FCCU).
The cracking reactions, which produce gasoline and heavier liquid fuels, also form coke on the fluidized catalyst, which is burned off in the regenerator using air. The blower, which supplied air to the regenerator's internal air manifold, had a capacity to draw air at about 90 fps through a 6-ft diameter line.
The calculated blower efficiency was below 90%, significantly less than that of other similar units and of critical concern because the FCC was blower limited. Suspecting that some non-ideal flow feature existed in the suction line, Mobil analysts used CFD to simulate the entire line from the ambient air inlet to the blower-intake port.
The 2.1 million-cell CFD model included all significant suction-line details, such as a chambered weather hood, several mitered bends, and a butterfly valve with a tapered wafer.
The large line diameter and length, coupled with the need for relatively small computational cells (between 0.25 and 0.50 in. on a side) to resolve boundary layers near the walls, led to a very high cell count.
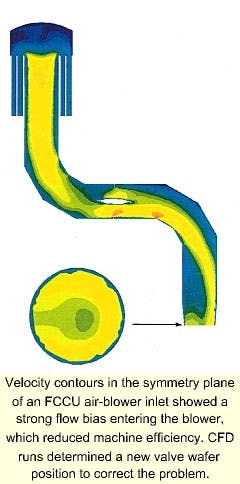
The analysis revealed that air flow through the line was strongly skewed by an unexpected interaction between two bends and the valve wafer in its normal open position.
As a result, the flow entering the blower was concentrated on one side of the line, a feature known to reduce machine efficiency. In effect, only half of the line cross-section at the blower inlet was being used.
Fig. 2 shows this uneven flow. Blue is slower flow, and yellow is faster flow. Ideally, the entire cross-section would be one color, designating a uniform velocity.
Having gained an understanding of the problem from the CFD results, Mobil analysts immediately considered adjusting the equilibrium open position of the valve wafer. The advantage of this approach was that it sidestepped much more expensive modifications to the blower inlet and less reliable tactics such as internal turning vanes.
After analysis of air flow through the suction line with the wafer in various positions, a configuration was found that eliminated almost all of the non-ideal flow pattern. The new wafer position allowed several percent greater air rate through the line at fixed pressure drop.
Fortunately, the change required simply reindexing the wafer relative to the positioning axle.
On a blower-limited FCC, such a rate increase has the potential for incremental capacity benefits exceeding $6 million/year.
Augmenting furnace output
A more complicated CFD application at Mobil focused on increasing the capacity of a refinery process through in-line combustion, an uncommon means of adding incremental heat. In the process, the feed-preheat furnace was a bottleneck that prevented a critical throughput increase.
Overhauling the furnace to increase its heat flux would have cost about $4 million. Instead, engineers proposed injecting a tiny amount of oxygen into the transfer line connecting the heater to the downstream process to stimulate in-line combustion and incrementally raise the feed temperature.
Before implementation of this concept, proof was needed that the injector could be designed to localize the combustion front-which might reach 2,000° F. near the center of the line with no risk of overheating the walls. The problem encompassed coupled fluid flow, heat and mass transfer, and reactions.
Mobil engineers used the combustion-modeling option within the Fluent package, representing the feed as a simplified mixture of hydrocarbons.
Analysts modeled the reactions using a 12-component kinetics scheme. This approach explicitly modeled methane through hexane molecules while treating the heavier hydrocarbons as inert. This approximation was reasonable because the six lightest compounds generated 95% of the combustion-heat release.
In addition to the lighter hydrocarbons, the kinetic model included oxygen, hydrogen, water, carbon monoxide, carbon dioxide, and an inert aggregate that included nitrogen.
Fluent simplified the task because it contains rate constants and activation energies not only for combustion of the hydrocarbons, but also for secondary reactions, such as water-gas shift. The availability of this information eliminated the need for engineers to search references for physical constants.
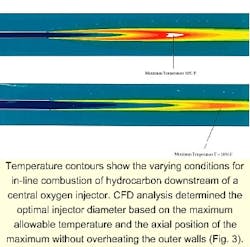
Mobil's goal was to determine the diameter of the center oxygen-injection pipe required to achieve the target feed-temperature rise, without overheating the transfer line walls or allowing combustion too near the injector tip. Fig. 3 shows the temperature profiles in the transfer line for two oxygen-injection diameters, as modeled by CFD.
The analysis provided several counterintuitive insights. For example, making the injector too small results in overheating the line. Reducing injector diameter raises oxygen-inlet velocity.
Increased velocity means that the oxygen travels a greater distance downstream before mixing with feed hydrocarbons to the degree necessary to stimulate combustion. While moving downstream, however, the oxygen also spreads outward, ultimately bringing the combustion front nearer to the walls.
With the understanding gained from the simulation results, engineers were able to optimize the injector design and proceed with the in-line combustion process.
Optimizing contactor effectiveness
An example of high-dollar benefits for Mobil using multiphase CFD involved a liquid-liquid contacting vessel commonly used in lubes refineries. The vessel brings oils into contact with an immiscible solvent to extract impurities. The result is a clean stream, which is preferred for manufacture of high-end products.
Feed oil enters the vessel and forms droplets, which are dispersed in the solvent. To ensure adequate residence time and attainment of mass-transfer equilibrium, baffle plates, arrayed within the vessel at various locations, create semi-isolated compartments for prolonged phase contacting.
The contacting vessel design, in particular the size and layout of the internal baffles, was based on empirical rules developed several decades ago. In most cases, these rules provided fairly good results.
Upon startup, the vessel in question achieved only 70% of its targeted extraction efficiency, creating a major shortfall in the available clean oil for production of high-margin products.
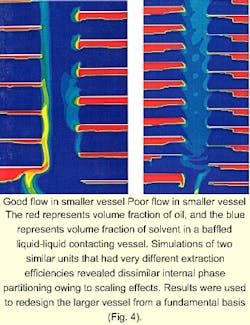
Most puzzling was the fact that a smaller unit, designed under the same rules and operating on similar feedstocks, achieved full design efficiency. Fluent consultants worked with Mobil analysts to model both vessels to understand this striking performance difference better.
CFD engineers used 150,000 cells to describe the unit internals and a full Eulerian multiphase model to describe the fluid mechanics. An Eulerian-Eulerian model is the most rigorous treatment available for interpenetrating liquids. It captures the fact that each phase in the contactor alters the flow of the other.
The Reynolds number, an indicator of the relative importance of fluid inertia and surface drag, was too low to apply a standard boundary-layer turbulence model near the walls and plate surfaces. Instead, Mobil analysts used the two-layer zonal model in Fluent. This model creates a relatively wide transition layer between the viscosity-affected flow region adjacent to the wall and the fully turbulent flow region far from the wall.
Results of the extractor analysis showed that because of scaling issues, the flow patterns in the two units had very few similarities (Fig. 4). In particular, the baffle arrangement in the smaller vessel led to far more favorable flow patterns for phase contacting than the layout that resulted from applying the same design rules to the larger one.
Mobil redesigned the large contactor with a significantly different baffle array based on the CFD findings.
In this case, it was necessary to build an entirely new unit. Contacting performance, however, far surpassed the original targets and the increased yield of high-value products paid back the vessel cost in only a few months.
Improving FCC regenerator performance
Another multiphase CFD application at Mobil examined gas and solids flow patterns in an FCC regenerator vessel with a fluidized bed.
Air from a blower enters the bottom of the regenerator through a highly branched manifold. The manifold is designed to create a uniform upward flow over the vessel's cross-section.
Hot particulate catalyst, laden with coke by-product, enters via a downwardly angled inlet, typically several feet in diameter. This inlet penetrates the vessel wall above the air grid.
Air passing upward through the catalyst burns the coke to gaseous products. The combined gas phase fluffs the particles into a fluid-like state, which allows them to move laterally within the regenerator vessel.
The preferred catalyst path is from the inlet to a similar, slightly lower, outlet in the vessel wall. This distance is typically about three-fourths of the vessel circumference.
Simultaneously, gas leaving the top of the fluidized bed, entraining some particles with it, enters cyclone separators. The cyclones use the centrifugal force of a swirl flow to disengage the catalyst and direct it back down to the bed while the solids-free gas exits the vessel.
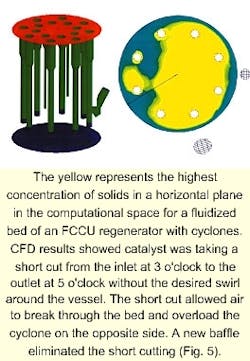
Engineers suspected that solids were short-circuiting the regenerator vessel directly from inlet to outlet.
Simulating an FCC regenerator calls on some of the most complicated physics in present-day CFD codes because it requires fluid-solid physical models. Engineers typically analyze multiphase flows as unsteady-state and continue the calculations until an equilibrium-flow field emerges.
The unit in question required 110,000 cells to describe the full vessel with eight cyclones and the asymmetrically located solids inlet and outlet. Fluent's Eulerian granular multiphase (EGM) model solved separate continuity, momentum, energy, and turbulence equations for the carrier fluid (the gas) and solids phase (the catalyst).
This exceptionally complex simulation, in which challenging multiphase calculations had to be performed in each of the 110,000 cells at every time step, took several weeks to run on an 8-processor computer.
Results of the CFD analysis confirmed engineers' suspicions that the catalyst was traveling by the shortest path from the inlet to the outlet, leaving up to one third of the vessel cross-section unused (Fig. 5).
Using vertical and horizontal slices easily generated from the converged flow field, Mobil engineers deciphered the three-dimensional gas and solids velocity profiles. This is a visualization that was not possible with experimental techniques.
CFD analysts then ran a second simulation with a vertical baffle strategically located in the fluidized bed to redirect the solids flow. The detailed results of the first case guided the sizing and orientation of the baffle.
The engineers finally recommended a baffle configuration that improved particle flow paths across the vessel and could be installed easily through a manway.
In an FCCU, the benefits of increased solids residence time in the regenerator are more cleanly burned catalyst and greater conversion of feed to high-value products for a fixed coke make. Such improvements are worth at least $1 million/year for each percent conversion gain.
The author
Greg Muldowney was a skill leader in applied fluid mechanics at Mobil Technology Co., Paulsboro, NJ. He holds a PHD in chemical engineering from the University of Illinois at Urbana-Champaign.
