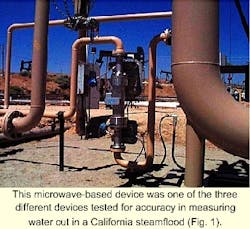
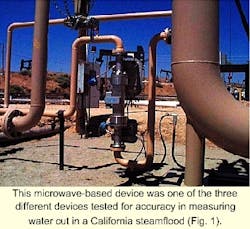
Test verifies water-cut meter accuracy in steamflood
A field evaluation undertaken by an operator has established the capability of new oil and water-monitoring devices accurately to measure water cut in producing streams that have different crude and water salinity.
The evaluation included microwave, density, and dielectric devices.
Measurement needs
Producers continue to seek ways to reduce production costs while operating in a safe and environmentally sound manner. Various operators have started to co-mingle smaller, producing properties into a large single facility because the cost of constructing and operating a single, large facility is significantly lower than these costs for several smaller facilities.
But to utilize a co-mingled facility, the operator must accurately measure the production from each property, which often produces different gravity crude and water salinity.
Water-cut measurement in a production stream is a challenge for operating personnel. The water content in a flow stream can change continuously. Manual sampling, even under the most rigorous conditions, may not represent the actual value of water cut in the flow stream.
To improve the accuracy, oil-water monitoring devices, such as the ones evaluated in this field test, have been used to obtain continuous on-line measurement of water cut. But the performances of all these devices are affected by the oil gravity and water salinity, as well as other fluid properties in the flow stream.
The operator must consider these parameters when selecting an oil-water monitoring device.
In a steamflood operation, such as the one at the test site, the composition of the flow stream may change continuously because of new wells brought on stream, additional perforations to existing wells, steam volume changes, and workover operations. All these events affect the composition and temperature of the production stream.
The oil-water monitoring device must, therefore, be able to adjust to these changes.
The field test was designed intentionally to simulate the wide range of fluid changes. The objective was to establish how the three commercially available oil-water monitoring devices respond to these changes and how well they can be adjusted to account for the changes in flow stream.
Test site
The measuring devices were field tested at a co-mingling station in Western Kern County, Calif. The site handles 54 wells, with a fluid production of 3,100 b/d that includes an average 75% water cut.
The oil is produced with cyclic and continual steam injection. The oil has an 11° API gravity and is at 174° F. The 6-in. line bringing the produced fluids into the site operates at 150-200 psi.
Periodically, freshwater is mixed with lease water for workover operations; therefore, the salinity of produced water can vary from fresh to 2,300 ppm. The production stream has very little free gas.
Manual sampling
At this site, conventional manual measurements are performed periodically to establish the water cut. The water-cut determination follows in-house established rigorous procedures which cover sample collection, addition of demulsifier, heating, and volumetric correction for temperature.
Six spot samples are pulled from the line, downstream of a static mixer, through a quill in the middle of the stream. The water cuts were obtained manually by averaging the values from six samples that varied by as much as plus or minus 5%.
Two capacitance probes have been obtaining on-line water-cut measurements. The probes are calibrated once per month and have had little fluctuation in their readings, showing a 74-76% water cut.
Testing new devices
Several new oil water monitoring devices have entered the market in the last 5 years. This equipment can monitor continuously on-line the water cut.1 Three of the devices were selected for field evaluation to establish if they could improve the accuracy and reduce the cost of manual bs&w determination. The three commercially available devices tested included a microwave, a density, and a dielectric-based device.
These devices use different technology for measuring oil and water content. References 2-4 discuss the development and operating principles for these devices.
Figs. 1 and 2 show how these devices were installed in the test loop. All three water cut devices were mounted in 3-in. piping, all within 25 ft of each other.
A SCADA system collected the data from each device. This allowed the data to be logged every second for 4 min during a series of calibration sampling. It also logged data every minute for 24 hr to obtain the daily average for each probe.
Field calibration
Calibration of the devices was tricky due to the changing water cut in the flowline. The meter site is 800 ft along the 6-in. line, carrying about 3,100 b/d at more than 150 psi and 174° F. The long flowline and low velocity causes free water to drop out before the flow arrives at the devices.
All three devices had to be calibrated when installed to adjust the factory calibration to the site fluid properties and flowing conditions.
Fig. 3 illustrates the difficulty of calibrating an oil-water monitoring device with field samples when the oil-water stream changes with time. In Fig. 3, the range of water cuts obtained by manual samples represents the variation in water cut as shown by the output of the oil-water monitoring devices. These manual water-cut samples were obtained over equal time during the 4 min of data logging.
Each device uses a different method for adjusting the calibration. The density device uses water density as an input to the meter to calculate water cut, whereas the dielectric device uses a constant offset to change the water cut value.3
Both units use trial and error calibration that requires sampling and then adjusting the meter. The procedure is tricky and very time consuming when the water cut changes each second.
The microwave device can download files to a laptop computer with the setup and configuration for oil-water monitoring. It also can do a line save for a selected amount of time.
With these files, one can run a simulation program to determine the meter configuration that provides the expected average water cut with the properties of the fluid going through the meter.
Table 1 shows the calibrations obtained 1 day before the tests.
Field tests
The water and oil used in the field test differed from the produced fluid. This was done to simulate the operating conditions, such as the combining of produced water and freshwater during workovers.
Operators use the combined water to kill wells during rod-packing repairs or in stimulating cold wells by pumping hot water down the wellbore. Gross stream leaving the lease, therefore, could change in water density or salinity. The field test was designed to simulate these changing operating conditions that would affect the performance of the oil-water monitor.
The test consisted of three phases. In the first phase, the oil-water monitoring devices were subjected to combined lease water to simulate 100% water cut condition. The second phase subjected the oil-water monitoring devices in the loop to a controlled low water cut stream before returning to the nominal, higher water cut production in the third phase.
Table 1 and Fig. 4 summarize the response of the oil-water monitoring devices. The dielectric device was adjusted at Point 1, and the density device at Point 2 was adjusted because of the changes in fluid properties.
The microwave device went through all three phases of the test without needing re-adjustment. As previously noted both density and dielectric devices had to be readjusted for changes in water and oil properties during the first and second phase of the test.
The adjustments were necessary; otherwise, the device would not read a proper water cut.
For the test, a vacuum truck was loaded with 100 bbl of clean combined lease water from the bottom of a wash tank. The truck's pump could move the water through the flowline at 2,000 b/d and into an empty vacuum truck. The 162° F. water was also slightly cooler than the normal process flow.
After 6 min, the flowlines were purged of normal fluids. At first, the devices reacted in the wrong direction because of some remaining oil. Then the readings changed.
The density device read 93.56% and then 96.6%, while the dielectric device read 7.5% and as low as 3.48% before leveling outs at 14.1%. The microwave device read 100.1% and remained at this level while the rest of the water was pumped.
The dielectric device read backwards. This error was due to the changes in the salinity of the water. The typically processed water has 0.02% salinity, but the combined lease water in the test had 0.14% salinity. After the dielectric device was adjusted with the new salinity, it obtained 99.8% water-cut reading.
The density device was about 4% low because the typical lease water density was different from that of the combined water. After being adjusted, the device read 100.6% water cut.
During the time the water was being pumped, the capacitance probes were reading 74.3% and 76.5% water cut. The 100% water did not change this reading.
Water was pumped for about 11/4 hr and at the end of the test the fluid temperature was 150° F.
The next test was on combined oil, obtained from tank bottoms on two leases. The truck pumped the oil at 2,100 b/d at 155° F. After 3 min, the three devices started to read good values and after 30 min, the readings stabilized.
Two spot samples were pulled and centrifuged on location, indicating a 37% water cut. The three other devices read as follows:
- Microwave-38.41%.
- Density-47.74%.
- Dielectric-34.78%.
The capacitance probes responded to the low water-cut condition. They read 27.4 and 24.0%.
The oil density being slightly different from the typical oil produced affected the density and dielectric devices. But the microwave device was within 1.4% of the spot sample taken.
Oil was pumped for about 45 min.
The third phase of the test opened the flow to lease oil. All devices took time to stabilize. This may have been caused by the flow rate and temperature changes in the loop, as well as the mixing and flushing of the production with the test fluids.
The density and microwave devices stabilized at about the 76-78% water cut, but the dielectric device showed consistently a greater water cut, probably due to previously set salinity calibration during the 100% water tests.
The capacitance probes read about 74% water cut.
Observations
As noted in this field test, the capacitance probe does not track the water cut in a water continuous stream.
The density and dielectric devices can track the water cut on-line, but any change in fluid properties would require a field intervention to adjust these devices. To conduct this field intervention, the operator must determine the accurate fluid properties. The devices, otherwise, will not record the correct water-cut measurement.
The microwave device tracked the water cut accurately without the need for field intervention. The device did require a purge time to stabilize the sensor when process conditions changed significantly.
References
- Mehdizadeh, P., "Better Net Oil Monitoring," Hart's E&P, August 2000.
- Mehdizadeh, P., and Farchy, D., "Multiphase Flow Metering Using Dissimilar Flow Sensors-Theory and Field Trials," Paper No. SPE 29847, SPE Middle East Oil Show, Mar. 11-14, 1995, Bahrain.
- Liu, K.T., and Kouba G.E., "Coriolis-based net oil computers gain acceptance at wellhead," OGJ, June 27, 1994.
- Yang, Y.S., Scott, B.N., and Cregger, B.B., "The Design, Development, and Field Testing of Water-Cut Meter Based on a Microwave Technique," Paper No. SPE 20697, SPE Annual Conference & Exhibition, Sept. 23-26, 1998, New Orleans.
The authors
Parviz Mehdizadeh is a consultant with Production Technology, Phoenix, Ariz. He provides clients with technical advice on multiphase measurements and marketing in the oil industry. He previously worked for Conoco Inc. and Agar Corp. Parviz has a BS and MS in physics and a Phd in chemical engineering and materials sciences from the University of Oklahoma. He is a member of SPE and has served on various API standardization committees.


