Liquids, Gas Demand Hikes Expected IN US This Year
Demand for petroleum products in the US will increase this year in step with a global oil market fast swinging away from surplus.
Another year of economic expansion will keep oil consumption rising in the US despite last year's price increases and the strong chance for further price gains early this year.
The price outlook depends on production by members of the Organization of Petroleum Exporting Countries, from which the market will need more crude than group members produced through most of 1999 under quotas in effect since April (see article, p. 62).
The US demand growth rate for energy of all forms will increase in 2000 despite a slowdown in economic expansion. The rate of demand growth will decline for oil but climb for natural gas. Oil production will drop again in the US-but not as much as it did in 1999.
With a heavy stock draw having run its course earlier in the US than worldwide, oil imports will climb after slipping for both crude and products last year.
The economy
In its ninth straight annual increase, the US gross domestic product (GDP) will rise by 2.7% in 2000 to $8.05 trillion. Last year's growth rate was an estimated 3.8%.
US economic strength helped the global economy weather the Asian financial collapse of 1997-98 and related economic problems in Europe and Latin America. Recoveries expected or under way in Asia and Europe now should help cushion a US economic correction that some observers consider overdue.
With economic growth strong and unemployment low last year, the US Federal Reserve raised interest rates under its control as a precaution against inflation. The higher rates coupled with oil prices elevated by OPEC production restraint will dampen economic growth this year.
Industrial production is expected to grow by 2.7% this year after rising by an estimated 2.6% in 1999 and 4.5% in 1998. Housing starts will decline to 1.5 million units in 2000 from 1.63 million units in 1999 and 1.62 million units in 1998.
Total auto sales are expected to decline to 6.6 million units from 6.9 million units last year and 6.8 million units in 1998.
Unemployment will stay low at an estimated 4.4% in 2000, compared with 4.3% in 1999 and 4.5% in 1998.
Total energy consumption
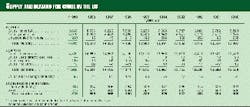
Economic growth will push total energy use in the US to 93.3 quadrillion btu (quads) this year, up 1.4% from 1999 consumption. The increase last year was 1.2%. Click here to view the OGJ forecast of supply and demand
This forcast is in PDf format and will open in a new window
Energy intensity-the amount of energy consumed per unit of economic growth-will decline again. The average this year will be 11,590 btu/(1992)$ of GDP, compared with 11,740 btu/$ in 1999 and 12,040 btu/$ in 1998.
While this year's relatively high oil prices will encourage steps by consumers to improve efficiency of energy use, the decline in energy intensity results from factors other than price.
A growing share of total economic output, for example, comes from activities that do not require large energy inputs.
According to the US Bureau of Economic Analysis, manufacturing's share of GDP decreased from 19% in 1987 to 17% in 1997. During the same period, the services share of GDP rose from 16.7% to 20.4%, and the finance, insurance, and real estate share climbed from 17.7% to 19.4%.
This structural reduction in the economy's energy intensity has an important side effect: It makes overall growth somewhat less sensitive than before to fluctuations in energy price.
Energy by source
Consumption will increase for all the major energy sources this year except nuclear.
OGJ projects oil-energy demand at 38.24 quads this year, up 1.4% from what the US Energy Information Administration estimates for 1999.
Petroleum's share of the energy market will be 41% in 2000, same as in 1999. Over the past two decades oil's share of the US market has fallen, first due to higher oil prices, and more recently because of competition from other fuels and environmental concerns.
Energy from natural gas will increase by 2.1% to 22.56 quads this year after increasing by 0.9% in 1999.
The natural gas share of the energy market will move up to 24.2% in 2000 from 24% in 1999. The share was 24.1% in 1998. The gas share will benefit from a price advantage against fuel oil in the utility power generation market. That normal advantage resumed in August after a 2 year absence. This year the price of gas will not increase as rapidly as fuel oil prices will.
Together, petroleum and natural gas will continue to dominate the energy market in 2000 with a combined share of 65.2%. This compares with a combined share of 65% in 1999 and 64.9% in 1998. The market share for these two fuels peaked at 77.7% in 1972.
A steady rise in energy consumption is being driven by increased demand for electrical power.
Hydroelectric and other sources will supply 3.47 quads this year, up 2.7%.
Energy from hydroelectric power dropped 7.1% in 1999 to 3.38 quads primarily due to reduced rainfall and snow levels in key areas. Hydro energy consumption will climb 2.7% to 3.47 quads in 2000 as a result of closer to normal weather and precipitation. This will account for 3.7% of the energy market, the same as last year but down from 4% in 1998.
Nuclear sources will provide 7.41 quads of energy this year, down 2.5% mainly due to plant reductions. Older nuclear power plants are being retired as their operating costs rise. Nuclear's share of the energy market will be 7.9% this year, down from 8.3% in 1999.
The number of operable nuclear power units peaked at 112 in the summer of 1990, fell to 109 in 1992, then increased to 110 in 1996. The number fell to 104 units in 1998, where it remained for 1999. The drop in demand for nuclear energy this year will be caused by a decrease in the utilization rate for existing plants.
Coal prices are expected to decline this year. Improvements in mining efficiency and recent closure of marginal, high-cost mines have cut coal costs for utilities.
Coal energy consumption, mainly for power generation, increased 0.2% in 1999 to 21.2 quads. As electric power consumption rises this year, the figure will increase by 2% to 21.62 quads.
Coal's energy market share, after a year of slight decline, will be 23.2% in 2000 vs. 23% the year before. Coal consumption will continue to increase in future years along with demand for electricity. However, environmental concerns and related costs of clean air regulations could slow the increase.
Oil supply
The 5.8 million b/d of crude and condensate production projected for 2000 would be a drop of 3.171 million b/d from the recent high of 8.971 million b/d in 1985: 35% in 15 years.
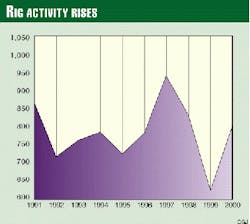
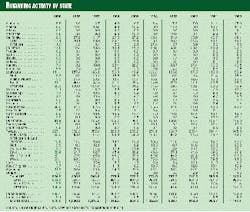
The Baker Hughes Inc. count of active rotary rigs averaged 625 for 1999, down from 831 in 1998. The monthly average of 496 in April was the low point for 1999. The rig count has risen steadily since then, ending the year at 771.
The largest decline occurred in Texas, where the average number of active rotary rigs dipped to 227 in 1999 vs. 302 in 1998.
Last year's rig count set a modern annual record low, breaking the 1992 level of 717.
Output of natural gas liquids (NGL) and other hydrocarbons will increase by 0.7% to 2.17 million b/d. Alone, NGL output will be 1.79 million b/d in 2000, up from 1.775 million b/d in 1999. NGL output averaged only 1.546 million b/d in 1989 but has been rising ever since due to the increase in production of natural gas, deeper extraction, and rising prices.
Total liquids production is projected to fall to 7.97 million b/d this year, a 2% decrease from last year. This is down 25% from a recent high of 10.636 million b/d in 1985.
Alaskan production of crude oil and lease condensate continues to fall. Production for 1999 averaged 1.07 million b/d, a 9% drop from 1998, and will be lower again this year. Production fell 9.3% to 1.175 million b/d in 1998 and 7% to 1.296 million b/d in 1997.
Higher prices this year will help slow the Alaskan decline rate. Investment will help maintain output, and new production from recent discoveries will prevent a much steeper decline. Alaskan output is expected to average 975,000 b/d in 2000.
Production for the Lower 48 averaged an estimated 4.905 million b/d for 1999. Earlier averages were 5.077 million b/d in 1998 and 5.156 million b/d in 1997.
Estimated 1999 production rates for the major producing states in the Lower 48 were Texas with 1.492 million b/d, down 55,000 b/d from 1998; Louisiana, 1.428 million b/d, down 4,000 b/d; California, 850,000 b/d, down 54,000 b/d; Oklahoma, 202,000 b/d, down 11,000 b/d; New Mexico, 186,000 b/d, down 12,000 b/d; and Wyoming, 174,000 b/d, down 4,000 b/d.
Lower 48 production will average 4.825 million b/d this year, down 32.6% from a recent high of 7.157 million b/d in 1984.
Imports
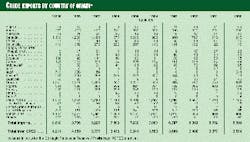
Total US imports of crude oil and petroleum products are estimated to have averaged 10.631 million b/d in 1999, down 0.7% from the previous year. Large withdrawal from inventories displaced supply from imports in 1999.
With less oil available from stocks this year, imports will rise 6.2% to an average of 11.29 million b/d.
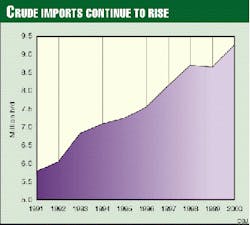
Crude oil imports will jump 7.2% to an average 9.28 million b/d after falling by 0.5% in 1999.
Product imports dropped 1.6% for 1999 but are expected to rise 2% this year to 2.01 million b/d.
Product imports have been as high as 2.3 million b/d in 1998 but fell to 1.6 million b/d in 1995 as refiners cut inventories.
No significant changes are anticipated in the amount of crude in the Strategic Petroleum Reserve (SPR).
The reserve storage facilities held 561 million bbl in underground caverns along the Gulf Coast early in 1999. During the year the US Department of Energy took royalty oil in kind from Outer Continental Shelf leases in the Gulf of Mexico to add to the SPR.
OGJ estimates that the volume of crude in the SPR will average 575 million bbl in 2000.
Stocks
Total industry stocks were estimated at 980 million bbl at yearend 1999, down from 1,060 million bbl at yearend 1998 and up from 977 million bbl at yearend 1997.
Stocks approached minimum operating levels in 1996, when yearend stocks plunged to 941 million bbl.
After a build averaging 216,000 b/d in 1998, US industry stocks fell by 265,000 b/d in 1999. In OGJ's view, inventories are again near minimum operating levels, leaving little room for a large annual withdrawal rate in 2000.
OGJ therefore expects 2000 yearend industry stocks to remain at 980 million bbl.
Refining
US refining capacity increased for the fourth consecutive year in 1999, while the utilization rate fell.
Average operable refining capacity increased to an average 16.27 million b/d from 15.802 million b/d in 1998. Capacity will increase again this year to 16.45 million b/d.
Crude runs to stills decreased in 1999 by 0.5% to average an estimated 14.82 million b/d but are expected to increase this year to 15.08 million b/d.
Total input to stills decreased 0.2% to 15.08 million b/d but will increase to 15.35 million b/d for 2000.
The refining capacity utilization rate fell 3.1% in 1999 to 92.7% but will rise this year to 93.3%.
Refining margins, prices
Increased crude oil costs eroded refining margins in 1999.
For the first 9 months of 1999 Gulf Coast cash operating margin as calculated by Ernst & Young Wright Killen & Co. averaged $0.60/bbl, compared with $1.36/bbl for the same period in 1998.
During the period, the margin swung from negative $0.68/bbl in February to $1.15/bbl in April, then to minus $0.26/bbl in May and up again to $1.35/bbl for August.
The estimated average US wellhead price of crude oil jumped to $15.65/bbl in 1999 from the 1998 average of $10.88/bbl, the lowest average price since 1978.
The average landed cost of imports increased to $16.40/bbl last year from $11.84/bbl in 1998. But it was still below the $18.11/bbl in 1997.
The average pump price for unleaded gasoline edged up to $1.155/gal in 1999 from $1.059/gal in 1998. The price averaged $1.231/gal in 1996 and $1.234/gal in 1997.
Total gasoline taxes at the pump averaged 40.1¢/gal in 1999, up from 39.9¢/gal in 1998, 39.6¢/gal in 1997 and 1996, 39.3¢/gal in 1995, and 37.5¢/gal in 1994.
The average wholesale price of No. 2 fuel oil rose to an estimated 51.5¢/gal in 1999 from 42.2¢/gal the previous year. This is still down from a recent high of 63.9¢/gal in 1996 and 59¢/gal in 1997.
Oil demand
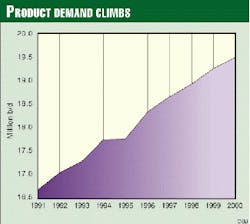
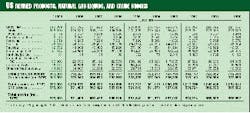
Consumption of all major products will climb in 2000. According to OGJ projections, total US demand including exports will be 20.43 million b/d, up from 20.18 million b/d last year.
Exports are expected to average 900,000 b/d in 2000, compared with 915,000 b/d in 1999, 945,000 b/d in 1998, and 792,000 b/d in 1997.
In 1999 US petroleum product demand before exports increased 1.8% to average 19.265 million b/d.
Even though the amount of oil energy consumed per dollar of GDP has been falling since 1973, petroleum product demand has been rising.
Oil-energy intensity dropped 46% to 4,800 btu/$ of GDP in 1999 from 8,900 btu/$ in 1973. Oil-energy consumption per dollar of GDP is projected to remain at 4,800 btu/$ this year.
Motor gasoline
Demand for motor gasoline in the US will move up in 2000-but not as much as last year.
Reflecting the slowdown in the economic growth rate, motor gasoline demand will rise 1.4% in 2000 vs. 1.7% in 1999. Slightly higher prices will ease some of the demand, but there will continue to be an increase in the number of miles driven per vehicle as well as a slowdown in the improvement in vehicle fuel efficiency.
Passenger car efficiency, as measured by miles per gallon, improved from a 1973 level of 13.4 mpg to 21.2 mpg in 1991. As consumer preference shifted to larger sport utility vehicles and small trucks the trend slowed. Average miles per gallon fell to 20.6 in 1993. Efficiency then improved again as older vehicles were replaced. In 1997, fuel efficiency reached 21.5 mpg. Preliminary figures place 1998 efficiency at 21.4 mpg.
Improvements in passenger car efficiency depend up buying preference and the rate at which older, less-efficient vehicles are replaced. Higher auto prices slow the replacement rate.
The number of miles driven per vehicle has set record highs in recent years. There has been a steady increase since 1993, when the average was 10,545 miles driven/vehicle. The average climbed to an estimated 11,725 miles/vehicle for 1998. In 1980 the average was only 8,813 miles/vehicle.
OGJ projects that for the ninth consecutive year demand for motor gasoline will increase, hitting a record high of 8.51 million b/d in 2000. This will be the eighth consecutive record. Last year demand was 8.39 million b/d.
Relatively low motor gasoline prices in recent years have contributed to the increase in fuel consumption. Last year's average pump price for unleaded gasoline of $1.155/gal was well below the record high of $1.378/gal set in 1981.
Jet fuel
OGJ projects that demand for jet fuel will rise 2.1% this year following an increase of 3.3% in 1999. This year's increase will come from a boost in air traffic and available capacity, but the growth rate trails last year's due to airfare hikes.
The expanding economy lifted demand for jet fuel to 1.675 million b/d in 1999. Demand this year will be 1.71 million b/d.
Consumption of jet fuel grew steadily during the 1980s then fell in the early 1990s as the economy entered a recession and the military cut consumption. Demand was 1.007 million b/d in 1981. It reached 1.522 million b/d in 1990, then fell to 1.454 million b/d in 1992. When the economy began to expand again, demand for jet fuel hit 1.578 million b/d in 1996.
Distillate fuel
Demand for distillate fuel oil increases with an improving economy, as there is growth in diesel trucking traffic, and when there is higher demand for home heating.
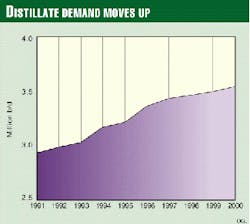
This will be the ninth consecutive year of higher distillate demand. After posting a 1.1% increase in 1999 to 3.5 million b/d, demand in 2000 will jump 1.4% to 3.55 million b/d.
Distillate demand hit an earlier peak in 1978 at 3.432 million b/d. Then higher prices led to conservation and fuel switching, causing demand to fall to 2.671 million b/d in 1982. Since then, lower oil prices and steady economic growth have resulted in steadily increasing demand for distillate.
Residual fuel oil
OGJ projects that demand for residual fuel will average 830,000 b/d this year, the same as in 1999.
In 1998 demand for resid was 887,000 b/d, up from 797,000 b/d in 1997. Falling oil prices improved the competitive position of resid in 1998 and caused the sharp increase in demand that year.
Resid consumption peaked in 1977 at 3.071 million b/d. The ensuing drop was mainly the result of a reduction in electric utility and industrial demand.
Resid deliveries sank to 672,000 b/d in November 1999, the American Petroleum Institute reported. November resid prices were comparable with October prices, while natural gas prices declined. This made gas more attractive to electric utilities and industrial users capable of switching fuels.
Other petroleum products
Demand for liquid petroleum gas (LPG) and ethane is projected to rise to a record high of 2.08 million b/d this year from 2.06 million b/d last year and 1.952 million b/d in 1998.
LPG and ethane demand hit a recent low 1.512 million b/d in 1986.
Demand for all other petroleum products, such as lube oils and asphalt, is projected to increase 1.2% in 2000 to 2.845 million b/d. Last year demand for this group of all other petroleum products jumped 2.5% to 2.81 million b/d.
Demand for these miscellaneous products is sensitive to changes in the overall economy. In particular, it fluctuates with the level of activity in the chemical and construction industries.
Increases in demand for petrochemical feedstocks are expected as the economy expands. Likewise, the steady increase in transport activity will translate into an increase in demand for asphalt and lubricants.
Natural gas
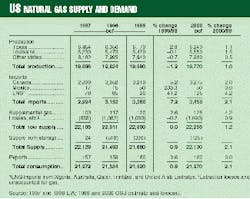
Total US natural gas consumption will increase 2.1% this year to 21.97 tcf. The most recent peak in demand for gas was 22.1 tcf in 1972.
But the outlook for gas demand depends heavily on weather, which is unpredictable and lately warmer than normal.
The increase in demand projected for 2000 assumes normal weather in the first and fourth quarters of the year. If weather is warmer than normal in those quarters, the demand gain won't fulfill the prediction.
The winters of 1997-98 and 1998-99 were abnormally warm. Total US gas consumption fell from 21.97 tcf in 1997 to 21.33 tcf in 1998 and 21.52 tcf in 1999.
Fears of shortage arose last year as high gas demand in the air conditioning season kept inventories from building as normal before the heating season.
Winter, however, began in the pattern of the prior two seasons: abnormally warm. November was so warm that there were net injections to underground storage, which caused prices at the wellhead to fall below $2/Mcf at times.
Gas demand will receive some support in 2000 from reestablishment of the gas price advantage over fuel oil. And it has long-term strength from penetration of the market for fuels for generation of electrical power.
Natural gas supply
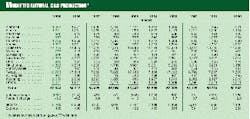
US marketed natural gas production will increase to 22.255 tcf this year from an estimated 22 tcf in 1999 and 22.016 tcf the year before.
The gap between consumption and domestic production has been filled by a sharply rising level of imports, mostly from Canada.
OGJ expects US imports of Canadian gas to rise to 3.275 tcf this year from 3.21 tcf in 1999, 3.052 tcf in 1998, and 2.899 tcf in 1997.
Imports of LNG will rise to 125 bcf from 120 bcf in 1999, 85 bcf in 1998, and 78 bcf in 1997. The US now imports LNG from Algeria, Australia, Qatar, Trinidad & Tobago, and the United Arab Emirates.
Gas imports from Mexico will remain at 50 bcf this year.
Imports from all sources will account for 15.5% of total US gas supply this year, compared with 15.36% last year.
The average US wellhead price of natural gas increased in 1999 to an estimated $2.15/Mcf from $1.96/Mcf in 1998, a year in which gas prices suffered from both warm weather and a slump in oil prices. The gas price averaged $2.32/Mcf in 1997 and $2.17/Mcf in 1996.
Those yearly fluctuations followed a period of relatively steady prices. During 1987-92 the price of natural gas averaged $1.67-1.74/Mcf. During that period imports increased rapidly while total consumption growth was relatively slow.
This year's average natural gas price is expected to increase to $2.30/Mcf.


