PRODUCTION LOGGING-Conclusion: Two more options correct fluid-density logs for friction
Two more methods for correcting friction effects on differential-pressure density logs from wells with high flow rates are third-party software and a nonlinear regression method.
Friction affects production logging tool response by causing the apparent density of the downhole fluid mixture to appear greater than it actually is. If these logs are not corrected properly, one may make inappropriate decisions, based on incorrect analyses, possibly leading to unnecessary workovers and reservoir mismanagement.
This third and concluding article in a series discusses third-party software and provides an elegant nonlinear regression method for accurately correcting these logs for friction effects.
Part 1 (OGJ, Dec. 4, 2000, p. 57) described the basics of two-phase production log interpretation; Part 2 (OGJ, Dec. 11, 2000, p. 60) presented a simple empirical friction correction for these logs.
Industry practice
After accepting a friction affected differential-pressure density log from a service company, one has to decide on a correction method for obtaining the true density of the downhole fluid mixture.
Current industry practice is to have the logging company correct and interpret the logs. Less popular is to do this with third-party software.
Employing a service company to acquire and interpret the production logs has the disadvantage that it is often difficult to quality control the analysis or re-interpret the raw data. This is because service companies use proprietary correction algorithms.
If one adopts this approach, one implicitly accepts that the service company will do everything with the utmost care and commitment.
Indeed this may be the case, but the analysis may give rise to the need for a workover program, possibly costing millions of dollars. This investment level then is being endorsed without conscious quality assurance of the base information.
The other risk is that the service company is providing a standard service that may overlook potentially valuable well or reservoir information.
Third-party software
By purchasing production log analysis software, such as Kappa Engineering's Emeraude package, one can interpret the density log and run sensitivities to quantify uncertainty in the analysis. The cost is about $15,000, but it will payback after a handful of wells have been analyzed.
Third-party software normally calculates the true density of the downhole fluid mixture by trial and error, using the energy conservation equation.
In third-party software, the generic algorithm consists of the following six steps:
- Load the input data, such as raw log curves, completion details, and tool properties.
- Analyze the spinner data to calculate total downhole flow rate.
- Input a first guess for the downhole fluid density.
- Compute the corresponding Reynolds number, spinner correction factor, and the pressure drop due to friction.
- Correct the differential-pressure density tool's raw measurement for deviation and friction and compare this with the first guess for the downhole fluid density.
- Refine the guess and repeat Step 4, if the result is not satisfactory. Eventually an acceptable match will be obtained in Step 6 with a corresponding correction for friction.
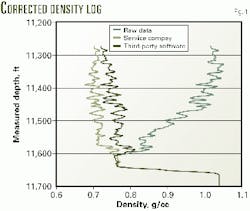
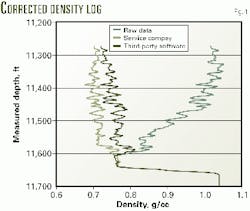
Fig. 1 illustrates results obtained from third-party software.
Software limitations
The correction algorithm within the third-party software is based on the fact that whenever a differential-pressure density tool is run in a well, there are three unknowns: true density of the downhole fluid mixture, relative casing roughness, and relative tool roughness.
With the energy conservation equation and an estimation of one of the unknowns, one can calculate the remaining two unknowns.
Third-party software normally requires one to input the relative casing roughness for calculating the true density, and it makes the assumption that either the tool is smooth (its relative roughness equals zero) or that the relative tool roughness is the same as that of the casing.
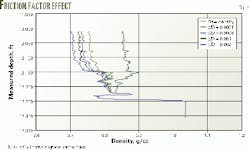
The relative roughness at downhole conditions has to be assumed because it cannot be measured directly. This is an obvious source of error in the analysis (Fig. 2).
Literature generally recommends using a value of 0.0006, but this value is not always justified.
Modeling friction correction
Wells are usually logged with six passes of the tool. To calibrate the spinner tool, three passes are up and three are down. Friction effects are a function of the differential velocity between the fluid, tool, and casing.
Changing the tool speed alters the friction effects acting on the tool; therefore, the six densities recorded will be different. Equation 1 (see equation box) is obtained from the energy conservation equation reworked to incorporate the tool component.
In Equation 1, a is the measured friction-affected density, b is the friction component due to the casing, c is the friction due to the logging tool, i denotes the particular logging pass in the well, and a is the true density, which is the quantity being sought.
Because service companies provide six raw density measurements, three up and three down passes at different cable speeds, one can write six equations with three unknowns. Therefore, any three equations can be used to determine the three unknowns, although there remains the problem of solving a matrix in the form of Equation 2.
This system of equations will only have parametric solutions; for example, the solutions are only obtained by assuming one of the variables. The first two coefficients in each equation are always constant. By definition, the true density is the same in each equation as is the casing friction term because the well is flowing at a constant rate.
Third-party generic algorithms for correcting density logs for friction assume the relative roughness of the tool and the casing to be the same, then calculate the density.
The energy equation, however, should be able to reproduce the differential-pressure density tool response for every case. Hence, one needs to find the casing and tool relative roughness to solve the problem. This can be done by nonlinear regression.
The least-squares method can determine the casing and tool relative roughness. In each of the six passes, because the casing and tool relative roughness are constant, one can minimize the error function, Equation 3, by assuming that the density and the fluid velocity in each point of the casing string are constant during the logging time.
Process steps
The whole process, including regression, can be done with Microsoft Excel's Solver tool. The basic process is as follows:
- Assume an initial relative roughness for the casing and tool.
- Calculate the downhole fluid mixture density using the average density as reported by the service company; for example, the downhole fluid mixture density is read when the tool is static.
- Use the density calculated in the previous step to predict the differential-pressure density tool response for each tool speed. This involves the recalculation of the friction factor each time because it is a function of the density. The error function can then be calculated.
- Regress on the values of the relative roughness, for both casing and tool, to minimize the error function. The error function is unlikely to be zero because the density tool response may be affected by kinetic effects. These effects cannot be processed out, but given the great amount of data, they do not significantly affect the final answer.
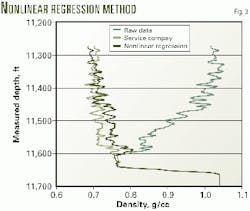
With this nonlinear regression procedure, one can simply and quickly calculate the three unknowns. Fig. 3 shows the results from such a calculation.
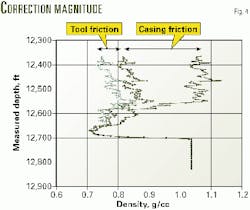
The non-linear regression approach also allows one to determine the different friction effects due to the tool and the casing. From Fig. 4, one can see that the casing friction can be much greater than that caused by the tool.
The advantage of this regression process is that the calculated density will change automatically with each iterative change in the values of relative roughness. It is, therefore, unnecessary to have internal iterations.
The major constraint of the non-linear method is that the individual density curves must be parallel to each other. If the log is run correctly, then this condition should be satisfied because the density recorded by the differential-pressure density tool will be a function of the tool's velocity.
The density shift due to casing friction at a given depth should be constant, irrespective of the tool's velocity. The difference, therefore, in the shift between passes is due solely to the tool's friction component.
A log has something wrong with it if the raw density curves cross over one another. This is not normally seen because the averaging process, an integral part of the standard analysis done by the wireline contractor, removes this information. This is unfortunate because this information can be used to correct for the friction effect without having to rely on assumptions.
Energy conservation equation
The modeling approach uses the energy conservation equation to calculate the downhole fluid mixture density and the associated friction effects. From the first law of thermodynamics, the energy conservation equation for incompressible fluid flow can be written as Equation 4.
In Equation 4, the terms represent the static head (change in potential energy), pressure head (changes in pressure from one point to another), velocity head (change in kinetic energy), and friction head (or energy loss due to friction).
Before Equation 4 can be used, one has to define the downhole velocity of the fluid mixture and the equivalent casing diameter. Equation 1 refers to the annulus between the casing and a stationary production-logging tool, so that one has to consider annular flow. Hence, the equivalent diameter, Deq, is four times the hydraulic radius of the annular section.1
The hydraulic radius of a given conduit is the cross-sectional area of the conduit filled by the fluid divided by the wetted perimeter. In this case, one can safely assume that the area between the pipe wall and the tool is completely filled with liquid, so that the conduit's cross-sectional area is the pipe's cross-sectional area minus the tool's cross-sectional area.
The wetted perimeter is the casing's perimeter plus the tool's perimeter. Thus, this hydraulic radius is defined as the area of flow cross section divided by the wetted perimeter (Equation 5).
In Equation 5, D is the casing's internal diameter and d is the tool diameter. The velocity is calculated based on the rate at a given point being constant (continuity equation), and recalling that flow rate is the product of fluid velocity and flow area (Q=VA). This then gives Equation 6.
It is important to remember that for any friction calculation between the casing and the tool, the annular velocity, Vann, has to be used and not the average fluid velocity as calculated from the spinner response.
The energy conservation equation can be rewritten as Equation 7 after one has made these substitutions and solved for downhole fluid mixture density.
Looking closely at Equation 7, one can see that the variables directly involved in calculating the energy equation are the pressure gradient over the tool, mixture density, fluid velocity, friction factor, and geometrical considerations (well deviation).
The pressure gradient can be obtained directly from the differential-pressure fluid density measurement. Remember, this tool does not measure density but the pressure difference between two points, so that its response equation can be rewritten to include the deviation angle of the well (Equation 8).
The friction factor is itself a function of the Reynolds number, which is a function of velocity, density, viscosity, and equivalent diameter. The friction factor, however, becomes independent of the Reynolds number when the flow regime is fully turbulent. Thus, it is not necessary to have an accurate calculation of the Reynolds number to estimate the friction factor.
The friction factor was calculated with Equation 9.2 For the relative roughness, e/D, a value of 0.0006 is usually assumed for steel pipe, as recommended in the literature.3
Two-phase flow
The non-liner regression method has given satisfactory results in wells producing above the bubblepoint pressure, in which no gas evolves along the logged interval. In wells producing below the bubble point, this method is more complicated because one needs to calculate the flow regime and knowledge of three-phase flow in an inclined pipe is limited.
A discussion on this multiphase flow is outside the scope of this article.
Friction correction comparisons
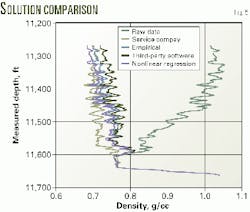
Fig 5 shows that all the methods give slightly different answers. But the empirical, third-party software, and nonlinear regression methods all exhibit the same shape and character.
The service company solution indicates a lower density at the base of the log and a higher density at the top of the log. This is strange because one would intuitively think that the friction correction would be greater as one approaches the top perforation, for example where velocity in the casing is at a maximum. Thus, the service company correction appears to be a block shift of the log.
In the case of the third-party software, if slightly higher friction terms were used, it would probably overlay the non-linear regression result.
Observations
Production logging provides a valuable source of reservoir dynamic data to operators, as long as its interpretation is done correctly. An accurate downhole fluid mixture density is paramount for reliable two-phase analysis.
This study has shown that high rate wells cause friction effects on differential-pressure density tools that make their analysis very difficult. Observed density shifts due to friction can be greater than 0.3 g/cc, the density difference between oil and water.
The best method for correcting these logs is the nonlinear regression solution because it allows estimates of the mixture density and the relative roughness of the casing and the tool to be made independently. The fact that casing relative roughness can be estimated independently may add value to friction studies downhole.
Extra sensors in the logging string may help greatly when interpreting the logs. Running a nuclear density tool to corroborate the differential-pressure density measurement can help to back out a tool's response. The holdup meter, which uses the capacitance measurement, is useful in wells with low to moderate water cut.
Finally, new array production logging tools are becoming available that claim to measure holdup, slip velocity, and have the ability to map fluids around the wellbore.
Acknowledgments
The authors want to thank Enterprise Oil plc for their permission to include its data in this series of three articles. We also want to thank Kappa Engineering for the Emeraude software and the support they gave while developing this study. Finally, our thanks go to Paul Jeffs, technical manager of Petrobras UK for reviewing these articles.
References
- Atherton D.H., "Fluid flow in pipes of annular cross-section," Transactions ASME, Vol. 48, 1926, pp. 145.
- Haaland S.E., "Simple and explicit formulas for the friction factor in turbulent pipe flow," Journal of Fluids Engineering, Vol. 105, March 1983, pp. 89.
- Edinburgh Petroleum Services Ltd., "Production Logging Course-Wireline measurements in cased hole," Course notes. Edinburgh 1997.
- Colebrook C.F. and White C.M., "The reduction of Carrying Capacity of pipes with age," Journal of the Institution of Civil Engineers, Vol. 7, 1937-1938, p. 99.
