Pore structure characteristics identify gas storage in high thermal-maturity shales

Dan Lin
Tingshan Zhang
Jijia Liao
Mingguan Liao
Southwest Petroleum University
Chengdu, China
Recent studies have shown that shales with high thermal maturity, like the Qiongzhusi formation in China's southern Sichaun and northern Yanman basins, are conducive to gas storage based on a variety of pore structures. Previously, low-porosity and low-permeability shales were treated as caprocks of hydrocarbon reservoirs.1 Research, however, has validated rich nanoscale pores capable of storing natural gas in a free, adsorbed, or dissolved state.2 The structures of these microscopic pores affect gas occurrence and thus have an important impact on the storage of shale gas.3
This article characterizes samples from the Qiongzhusi formation showing that it is dominated by mesopores, with some micropores and macropores. Mesopores are the main contributors to shale-specific surface area and pore volume. The shale has ink-bottle shaped, parallel-plate shaped, and various types of compound pores.
The relationship between pore size distribution and degree of thermal evolution (Ro) in shale is complex, rather than a simple positive or negative correlation. For the Qiongzhusi formation, Ro values are greater than 3.2%. Illite has a large specific surface area. Decreases in illite content therefore affect the samples' total specific surface area. Mud-shale specific surface area and pore volume are positively correlated with total organic compound (TOC) and mixed-layer illite/smectite (I/S) content, indicating that the development of pores in shale is related to organic matter's content and the types of clay present in the shale.
Methodology
Successful shale gas exploration requires effective pore analysis.4 Accurate characterization of the variety of pore structures. While most shales have an average nanoscale pore size, it is hard to characterize their structure using conventional techniques such as mercury intrusion porosimetry.
The gas adsorption method effectively represents nanoscale pore distribution in shale. This article introduces low-pressure nitrogen (N2) adsorption and relevant tests on handpicked shale samples with high thermal maturity to reveal their microscopic pore structure characteristics and explore relationships of pore size distribution in shale by TOC, clay mineral type, and content, and Ro to identify factors that affect shale porosity development.
This study used samples from the Lower Paleozoic Qiongzhusi formation in southern Sichuan and northern Yanman, a pilot area in China's strategic survey of its shale gas resources. The samples derive from a sedimentary marine-shelf environment, where dark shale, black-silty shale, and black carbonaceous shale developed.5 6
Nitrogen adsorption tests identified specific surface area and pore size through the physical adsorption isothermal static method. The equipment applied to these tests could measure pore sizes of 3.5-2,000 angstrom (Å), with an exact minimum specific surface area of 0.01 sq m/g and minimum pore volume of 0.1 cu mm/g. Researchers vacuum pretreated all shale samples at 80° C. for 12 hr to ensure that residually bound water and capillary moisture was evaporated. With 99.999% pure nitrogen as the adsorbate, adsorption and desorption isotherms were set at distinct partial temperatures of 77 K. Organic carbon and sulfur analysis determined TOC for each sample
Soaking the samples in diluted hydrochloric acid for 12 hr and then in concentrated hydrochloric acid for 2 hr completely removed any carbonate rocks. The samples were next washed with distilled water to remove the hydrochloric acid and then dried for later use. Technicians prepared two specimens of each sample.
An automatic X-ray diffractometer determined the whole-rock mineral composition. The test was conducted under the following conditions:
• Target = Copper (Cu), monochrome
• Radiation = Kα
• Operating voltage = 35 kv
• Operating current = 30 amp
• Scattering angle, 2θ = 3.85°
• Slit = 1 mm
The test determined mineral composition by continuously scanning at 3°/min with a sampling interval of 0.02°. Step-scanning at a speed of 0.25°/min with a sampling interval of 0.01° provided quantitative analysis.
China National standards GB/T19587-2004 call for specific surface area of each shale sample to be calculated using the Brunauer, Emmett, and Teller equation (BET).7 With a relative pressure range of 0.05-0.35 psi, a straight line BET plot identified the saturated adsorption of the molecular monolayer. This data provides calculation for the BET specific surface area of the sample.
Pore size distribution is calculated with the Barrett, Joyner, and Halenda (BJH) method, where pore volume and average pore size are based on nitrogen adsorption at a relative pressure of 0.993 psi.8 9
Sample delineation
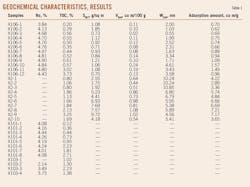
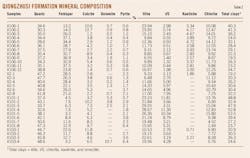
After tests, the samples contained TOC contents of 0.6-3.73% and Ro values greater than 2%, indicating high thermal maturity and a complex mineral composition (Tables 1 and 2). Generally, the quartz content was highest, at 28.6-50.6% and averaging 39.24%. Next were clay minerals, at 19.2-52.8% and averaging 31.78%. Clay minerals included illite, which had the highest average concentration at 16.34%, followed by chlorite with an average concentration of 9.96%, mixed-layer illite/smectite (I/S) with 3.88%, and kaolinite with the lowest average, 1.61%. The samples also contained feldspar, calcite, dolomite, and pyrite. Almost all samples contained pyrite, with an average concentration of 1.89%.
Adsorption, desorption
Fig. 1 shows the N2 adsorption and desorption curves for the shale samples. Despite slight differences in shape, the adsorption isotherms of all samples are essentially isotherm Type IV. This result, together with the hysteresis loop's shape, indicates that the shale is dominated by mesopores. Adsorption saturation did not occur when equilibrium pressure approached vapor pressure, demonstrating that the shale samples also have macropores.
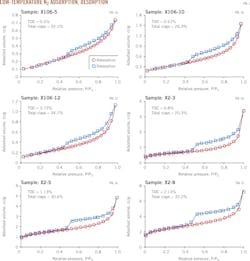
The shape of the hysteresis loop reflects shale pore structure. Based on the International Union of Pure and Applied Chemistry classification system, the hysteresis loops of samples X2-3, X2-5, and X2-8 are similar to hysteresis loop Type H2, indicating the presence of many ink-bottle shaped pores. The hysteresis loops of shale samples X106-5, X106-10, and X106-12 are Type H3, reflecting the existence of parallel-plateshaped slit pores in the samples. The shale's complex pore structure, with varying shapes and sizes, tended to generate hysteresis loops combining two or more types.
Pore size distribution
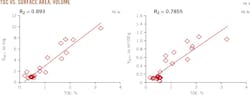
The samples have specific surface areas of 0.70-9.72 sq m/g, with an average of 2.92 sq m/g; pore volumes of 0.02-1.08 cu m/100 g, with an average of 0.41 cu m/100 g, and pore sizes of 0.55-10.85 nanometers (nm), with an average of 4.69 nm (Table 1). Mud shale has a larger surface area and pore volume. The two parameters have a strong and positive correlation, with a correlation coefficient of 0.86 (Fig. 2).
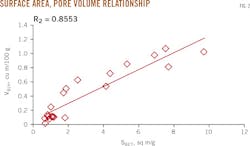
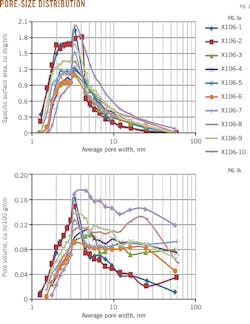
Fig. 3 shows the pore size distribution curve. Pores sized 2-5 nm contribute most to the pore specific-surface area. Pores sized 3-5 nm and 10-12 nm contribute relatively more to pore volume, indicating that mesopores contributed the most to the samples' specific surface areas and pore volumes. Micropores contributed less to specific surface areas and pore volumes, and macropores the least to specific surface areas, with varying contributions to the pore volumes depending on the sample.
Controlling factors
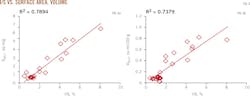
The development of microscopic pores in mud shale is closely related to its organic carbon content. When organic carbon content is higher, pore specific-surface areas and pore volumes are larger, with correlation coefficients of 0.89 and 0.79, respectively (Fig. 4). These close correlations indicate that shale TOC content is the most important factor influencing shale pore-size distribution. Other factors, however, influence shale pore structure.
When Ro increases to a certain point, organic pores appear from the organic particles in the shale, changing pore size distribution. The increase in Ro also causes transformation in clay minerals, leading to changes in specific surface area and pore volume in shale. The results of the mineral composition test indicate that all samples contain no smectite, deeply buried smectite having been completely converted to I/S or illite.
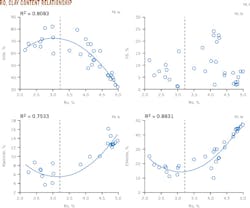
As shown in Fig. 5, when Ro is 2.0-3.2%, illite content increases as Ro increases. But when Ro is 3.2-5.0%, illite content decreases as Ro increases. The correlation of kaolinite and chlorite with Ro is inverse to that of illite content. The change in the I/S content has no significant correlation with Ro.
The specific surface area and pore volume of mud shale are closely related to the presence of clay minerals. Different types of clay minerals have different specific surface areas. Smectite's surface area can reach 800 cc/g, illite can reach 30 cc/g, chlorite and kaolinite are small, reaching 15 cc/g, and I/S lies between smectite and illite.10
The I/S content in shale samples from the surveyed area is only 3.88%. I/S content has a close and positive correlation to shale's specific surface area and pore volume (Fig. 6). As almost all samples have Ro > 3.2%, the content of illite, which has a large specific surface area, decreases, while kaolinite and chlorite, with small specific surface areas, increase. This condition affects the specific surface area of the shale.
References
1. Newsham, K.E. and Rushing, J.A., "An integrated work-flow model to characterize unconventional gas resources: Geological assessment and petro physical evaluation," Society of Petroleum Engineers Annual Technical Conference and Exhibition, New Orleans, Sep. 30-Oct. 3, 2001.
2. Curtis, J.B., "Fractured shale-gas systems," American Association Petroleum Geologists Bulletin (AAPG Bull.), Vol. 86, No. 11, November 2002, pp. 1921-1938.
3. Zhang, X.F., Lu, X.C., Zhang, L.Y., and Liu, Q., "Occurrences of shale gas and their petroleum geological significance," Advances in Earth Science, Vol. 25, No. 6, June 10, 2010, pp. 597-604.
4. Hill, R.J., Etuan, Z., Katz, B.J., and Tang, Y.C., "Modeling of gas generation from the Barnett Shale, Fort Worth Basin, Texas," AAPG Bull., Vol. 91, No. 4, April 2007, pp. 501-521.
5. Mei, M.X., Zhang, C., Zhang, H., Meng, X.Q., and Chen, Y.H., "Sequence stratigraphic frameworks and their forming backgrounds of paleogeography for the Lower Cambrian of the Upper-Yangtze region," Geoscience, Vol. 20, No. 2, Jan. 15, 2006, pp. 195-208.
6. Wang, L.B., Jiu, K., Zeng, W.T., Fu, J.L., and Zhao, S., "Characteristics of Lower Cambrian marine black shales and evaluation of shale gas prospective area in Qianbei area, Upper Yangtze region," Acta Petrologica Sinica, September 2013, pp. 3263-3278.
7. Brunauer, S., Emmett, P. H., and Teller, E., "Adsorption of gases in multimolecular layer," Journal of the American Chemical Society, Vol. 60, No. 2, February 1938, pp. 309-319.
8. Barrett, E.P., Joyner, L.G., and Halenda, P.H., "The determination of pore volume and area distributions in porous substances," Journal of the American Chemical Society, Vol. 73, No. 1, January 1951, pp. 373-380.
9. Gregg, S.J., and Sing, K.S.W., "Adsorption, surface area and porosity," Academic Press, Feb. 11, 1982, pp. 303.
10. Passey, Q.R., Bohacs, K.M., Esch, W.L., Klimentidis, R., and Sinha, S., "From oil-prone source rock to gas-producing shale reservoir-geologic and petrophysical characterization of unconventional shale-gas reservoirs," SPE International Oil and Gas Conference and Exhibition, Beijing, June 8-10, 2010.
The authors
Dan Lin ([email protected]) is a PhD candidate in geoscience at Southwest Petroleum University, Chengdu. She holds a BS in business administration and an MS in mineral prospecting and exploration from Southwest Petroleum University.
Tingshan Zhang ([email protected]) is a professor of geoscience and technology at Southwest Petroleum University. He holds a BS, an MS, and a PhD in geology from Nanjing University, Nanjing, China.
Jijia Liao ([email protected]) is an assistant professor of geoscience at Southwest Petroleum University. He holds a BS in resource exploration engineering and an MS in mineral prospecting and exploration from Southwest Petroleum University, and a PhD in geology from China University of Petroleum, Beijing.
Mingguang Liao ([email protected]) is a professor of geoscience and technology at Southwest Petroleum University. He holds a BS in resource exploration engineering, an MS in mineral prospecting and exploration and a PhD in coal geology from Southwest Petroleum University.