Rollercoaster week for oil prices ends with a surprise
Oil, fundamental analysis
Oil prices started the week off higher but faltered as a result of continuing concerns over a glut in the near-term and the first refined product storage gains in several weeks but despite a draw in crude inventories.
Another proposed Russia/Ukraine peace deal as well as, the new plan for US offshore oil and gas leases took prices down to a key technical Low by week’s end. WTI prices had their weekly high of $60.95/bbl on Tuesday but fell to a low of $57.90 by Friday having dropped below the critical $60.00/bbl mark.
December 2025 NYMEX futures expired Thursday and January 2026 became the “prompt” month on Friday. Brent followed a similar pattern, hitting its high of $65.10/bbl on Tuesday with its weekly low of $61.85 on Friday as well. Both grades settled lower vs. the prior week while the WTI/Brent spread has widened to ($4.50).
Most of the oil market sentiment these days is clearly centered around an oversupply scenario lasting well into next year. The IEA has forecasted a daily surplus of up to 4.0 million b/d in 2026 largely due to increased production from non-OPEC countries.
A new Russia/Ukraine peace plan was announced Thursday, and the US is encouraging Ukrainian President Zelensky to sign the agreement forged with Moscow. Unfortunately, it contains similar Ukrainian concessions as those of previous proposals Zelensky has stated he will not agree with. The recognition of Russia’s claim to the Crimean Region which they took by force, the ceding of territories occupied by Russian forces and disallowing Ukraine’s membership in NATO are all in this version. Savvy market watchers will give this agreement similar odds of success as those of the past. The latest sanctions on Russian crude are starting to show an impact as the price of Urals in the Black Sea has dropped to $36/bbl, the lowest in 3 years.
The announcement by the current Administration to open-up the federal waters off the coasts of California, Florida, and Alaska was immediately taken as more bearish news for oil supply. However, this is definitely a premature reaction as any development would be far down the road and would have to result in a change from the current capital discipline policies of most US exploration and production (E&P) companies. We may see lease buying but not a clear timeframe for the actual investment. Drilling off of Florida’s West Coast is very controversial due to the state’s reliance on tourism.
The Energy Information Administration’s (EIA) Weekly Petroleum Status Report indicated that commercial crude oil inventories for last week decreased while production held at 13.8 million b/d. The Strategic PEtroleum REserve was up 535,000 bbl to 411 million bbl.
Despite a strong earnings report by chipmaker, Nvidia, US stock markets fell this week on a rise in unemployment and a report indicating the US economy lost more jobs again in August. But a delayed BLS report for September indicated job growth of 119,000, above expectations. However, unemployment rose from 4.3% to 4.4%. US wholesale inventories were flat in August vs. forecasts for a fall of (0.2%). The Dow is up on the week while the S&P and NASDAQ are lower. The USD is higher which is bearish for crude prices.
Oil, technical analysis
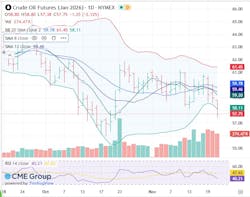
January 2026 WTI NYMEX futures take over the front month spot this week and are trading below their 8-, 10- and 20-day Moving Averages and below the Lower-Bollinger Band Limit, an oversold condition which normally spurs buying. Volume is around the recent average at 275,000. The Relative Strength Indicator (RSI), a momentum indicator, is moving lower out of neutral territory into the oversold.” area. Resistance is now pegged at $59.00 (Thursday’s close) while near-term critical Support is $57.00.
Looking ahead
First and foremost, a breach of either the Upper- or Lower-Bollinger Band limit invariably leads to an opposite market reaction, i.e., buying when breaching the Lower limit and selling when breaching the Upper limit (“Reversion to the Mean”). We see it time and time again, but it is hard to predict exactly how long it will take the reversal to occur.
Next, given that the provisions of the latest Russia/Ukraine peace proposal highly favor Putin, Zelensky’s agreement appears doubtful. Trump is threatening the cancelation of military weaponry for Ukraine if they do not agree to the accord so, we will have to see what happens. The current market reaction has been one in which sanctions against Russia get lifted and their oil exports flow freely. Meanwhile, the lower distillate inventories could impact domestic heating oil prices should a cold front hit and stay along the Northeast US corridor. As of Sunday, we can officially bid farewell to the 2025 Hurricane Season.
Natural gas, fundamental analysis
December NYMEX natural gas futures continued higher this week again as traders remain bullish on weather and as the first withdrawal of the season occurred last week. The week’s High was $4.68/MMbtu on Friday while the week’s Low was $4.24 on Tuesday (right at the 20-day MA). Supply/demand data has yet to be restored. However, LNG export volumes remain at slightly above the 16.0 bcfd level.
In the UK, natural gas prices at the NBP were most recently $11.70/MMbtu while Dutch TTF futures were $10.25 and Asia’s JKM was quoted at $11.70/MMbtu. The NBP/JKM parity reflects the increasing European demand for LNG and the price needed to compete with cargoes destined for Asia. The EIA’s Weekly Natural Gas Storage Report indicated a withdrawal of 14 bcf, the first of the season and matching forecasts. Total gas in storage is now 3.946 tcf, now at -0.6% below last year and +3.8% above the 5-year average.
Natural gas, technical analysis
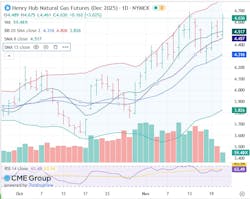
December 2025 NYMEX Henry Hub Natural Gas futures maintained prices levels from the prior week in a reverses pattern, moving past their 8-, 13- & 20-day Moving Averages. Volume was 60k on the decline as December expires next week and attention turns to January. The RSI has moved into overbought territory at 63 on this week’s rally. Support is $4.52 (8-day MA) with key Resistance at $4.70.
Looking ahead
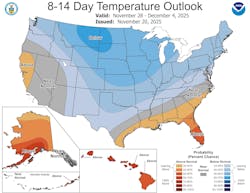
Thus far, actual weather has not followed the forecasts in terms of widespread cold temperatures. However, the most recent 8-14-day outlook shows a very wide segment of the US experiencing normal to below-normal temperatures into the first few days of December. 'Normal' would represent increased natural gas demand.
About the Author

Tom Seng
Dr. Tom Seng is an Assistant Professor of Professional Practice in Energy at the Ralph Lowe Energy Institute, Neeley School of Business, Texas Christian University, in Fort Worth, Tex.