Without geopolitical risk, oil prices fall on supply glut

Oil, fundamental analysis
Absent any new geopolitical risk premium, crude markets this week focused on supply-side concerns resulting in a steady stair-step lower. This was a continuation of the downtrend that started in the prior week on the Trump threat of 100% tariff increases on Chinese imports. Also, a large drop in US refinery utilization led to another weekly crude inventory gain. Prices would fall below $60/bbl and continue lower towards the week’s end.
The US grade started the week as high as $60.17/bbl on Monday but never returned to above the critical $60.00/bbl mark. The low mark of $56.60/bbl was on Friday. The downturn continued to widen the technical area of 2-Standard Deviations from the 2-day Moving Average with the daily Lows straddling the lower limits.
Brent followed a similar pattern, hitting its high of $63.95/bbl on Monday and its weekly low of $60.15 on Friday. Both grades settled much lower week-on-week. The WTI/Brent spread has tightened to ($4.05). WTI prices haven’t been this low since May 1.
The continuing trade dispute between the US and China has added a dim outlook for global economic growth and, in turn, the outlook for future energy demand. However, market sentiment changes daily and the leaders of the two countries are expected to meet at the end of the month. But even that event seems doubtful should both sides maintain their hardline stances on trade.
The US government shut-down is also negatively impacting the economy each day it continues and as the Trump administration looks to furlough thousands. Additionally, layoffs in the thousands have been announced by oil majors due to the current unsustainable price levels.
A Trump-proposed meeting with Russian President Vladimir Putin in another attempt to bring an end to the Ukraine war has added bearish sentiment given the increased Russian output that could occur. And, despite a few cracks, the Israel/Hamas ceasefire is holding thus far, which signals less geopolitical risk in oil markets.
Meanwhile, data from the International Energy Agency (IEA) in Paris only managed to further propel prices lower as the agency now sees oil supply growth of 3.0 million b/d for 2025 and growth of 2.4 million b/d for 2026 compared with its last forecast calling for growth of 2.7 million b/d and 2.1 million b/d, respectively. Demand is expected to increase but not even be close to the projected supply growth.
The Energy Information Administration’s (EIA) Weekly Petroleum Status Report indicated that commercial crude oil inventories for last week increased by 3.5 million bbl to a total of 424 million bbl largely on a huge drop in refining activity. The Strategic Petroleum Reserve was up 76,000 bbl to 407.7 million bbl. Total US oil production was 13.6 million b/d vs. 13.5 last year at this time.
Regional banking lenders reported loan losses Thursday with one large commercial loan allegedly granted to a fraudulent borrower, sparking concerns over other possible hidden risks in bank loan portfolios. Auto parts maker First Brands’ bankruptcy also hinted at problems with large C&I lending. And Pres. Trump’s fickle approach to tariffs, specifically with regards to China, has the stock market in a rollercoaster pattern of late.
All 3 major US stock indexes are higher week-on-week after last Friday’s huge drop on Trump’s Chinese tariff increase threat. The USD is also up this week, which tends to suppress oil prices as well.
Oil, technical analysis
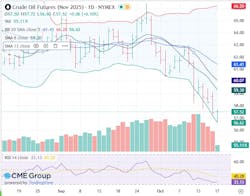
November 2025 WTI NYMEX futures prices continued moving lower from their 8-, 10- and 20-day Moving Averages this week while hugging the the Lower-Bollinger Band limit, a Buy signal as it represents 2 Standard Deviations below the Mean. Volume is below recent average at 55,000. The Relative Strength Indicator (RSI), a momentum indicator, is now in oversold territory at 33, another potential Buy signal. Resistance is now pegged at $57.50 while near-term critical Support is $56.60 (Lower Bollinger Band Limit).
Looking ahead
Markets will be watching to see if the Trump/Jinping meeting goes forward as announced and what, if any, positive agreements on trade result. A Trump/Putin meeting may also impact crude markets should actual progress toward peace occur. Past meetings have not moved the needle on even a ceasefire, however.
We are now far enough away from the summer driving season that we are seeing much lower refinery activity. October and November are also the turnaround periods whereby routine maintenance is performed as well as, the preparation for the change in seasonal gasoline blending.
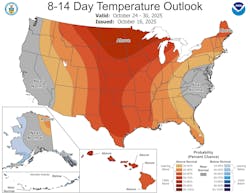
The Tropics continue to be a non-event in terms of any threats to the Gulf of Mexico as all storms thus far have remained in the Central Atlantic, impacting the East Coast. A weak La Niña pattern has emerged in the Pacific Ocean. That could bring colder temperatures this winter to the Northeast region which happens to be the world’s largest consumer of heating oil.

Natural gas, fundamental analysis
November NYMEX natural gas futures fell victim to the same dynamics of the crude and refined product markets this week along with a large storage injection. The week’s High was $3.14/MMbtu on Monday while the week’s Low was $2.90 on Friday. By week’s end, however, prices were hovering around the $3.00/MMbtu mark.
Supply/demand data was not available this week due to the shutdown.
Dutch TTF prices are holding at around $11.00/MMbtu while Asia’s JKM was quoted at $11.20/MMbtu.
EIA’s Weekly Natural Gas Storage Report indicated an injection of 80 bcf, below the forecasted injection of 78 bcf. Total gas in storage is now 3.721 tcf, holding at just 0.7% above last year and down to 435% above the 5-year average.
Theoretically, there are just 3 weeks left in the official injection season. To achieve a season-ending volume of 3.9 tcf, injections would only have to average 60 bcf per week and 93 bcf to reach 4.0 tcf. If we factor in the possibility of injections during the first 2 weeks of November, 4.0 tcf could be reached with only an average injection of 56 bcf per week.
Natural gas, – technical analysis
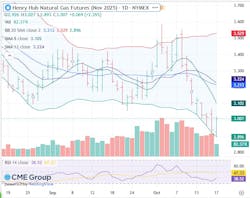
November 2025 NYMEX Henry Hub Natural Gas futures also continue to trade below the 8-, 13- & 20-day Moving Averages and are approaching the Lower-Bollinger Band limit. Volume was 85,000, below the recent average. The RSI is oversold at 39. Critical Support is pegged at $2.90 (Lower-Bollinger Band limit) with key Resistance at $3.05.
Looking ahead
Another 80 bcf storage injection has accelerated the prospects of a season-ending total of 3.9 tcf. Largely because the current weather outlook may lead to large injections into mid-November, essentially extending the injection season. Again, the Tropics have not impacted GOM natural gas production either while the weak La Niña could be demand for natural gas space heating along the Eastern Seaboard later in the winter.
About the Author

Tom Seng
Dr. Tom Seng is an Assistant Professor of Professional Practice in Energy at the Ralph Lowe Energy Institute, Neeley School of Business, Texas Christian University, in Fort Worth, Tex.